Public Storage (PSA)
Public Storage research profile covering self-storage property economics, portfolio scale, occupancy, growth and REIT valuation.
Educational analysis for professional use. This profile is not investment advice or a recommendation to buy or sell any security, and it is not personalised.
Snapshot
Business Overview
PSA earns when existing tenants stay put and absorb rent hikes at renewal. Since absorbing National Storage Affiliates in July 2026, the company owns or operates over 4,500 self-storage facilities in the United States, totalling 327 million net rentable square feet, alongside a 35% stake in Shurgard, which runs 333 facilities in Western Europe. Maintenance capex is low. Month-to-month leases sound risky, but switching costs keep churn contained: nobody wants to rent a truck, pack boxes, and move their stuff across town to save $15 a month.
That dynamic feeds directly into PSA's core profit lever: existing customer rate increases, or ECRI. New tenants come in at whatever the local market will bear that week, often below what sitting tenants pay. Once they settle in, PSA pushes their rent up at each renewal, harvesting the gap. The two prices are worth tracking separately, because they can move in opposite directions for years: through 2025 move-in rents kept falling while realised rent across the occupied portfolio still edged up 0.5%, to $22.54 per square foot. In the second quarter of 2026 that finally turned, with average move-in rents up 1.6% year-over-year, the first time since 2021 that PSA raised the price to new customers and held occupancy at the same time.
What to Watch in the Financials
Headline FFO looks fine; the same-store pool is where the stress shows. Full-year 2025 core FFO was $16.97 per share (+1.8% year-over-year), Q4 core FFO of $4.26 beat consensus, and revenue reached $4.82 billion (+2.7%). Against that, Q4 same-store revenue fell 0.2%, full-year same-store revenue was flat, and FY2025 same-store NOI declined 0.5% across 2,565 facilities. The 2026 guidance issued with those results looked for more of the same, at $16.35 to $17.00 of core FFO and same-store NOI down 0.5% to 3.9%. By July PSA had raised it to $16.75 to $17.05, with the NOI decline narrowed to 0.3–2.0%.
Same-store occupancy ended 2025 at 91.0%, up 50 basis points from 90.5% a year earlier, against 94.8% at the end of 2021. Occupancy is the easiest number in storage to buy, though. A facility holds its unit count by discounting the advertised rate to whoever walks in, and the headline percentage never shows it, because the discount lands in move-in rent, which is reported separately. So those 50 basis points, won while move-in rents were falling, are not the same achievement as 50 points won while they rise. At 91% this is not a crisis market, but nor is it tight enough to push rents hard. If occupancy drifts toward 89%, ECRI becomes much harder to execute.
Four numbers to track each quarter. Same-store revenue growth shows whether ECRI is offsetting weak move-in rates. Watch the spread between move-in and existing-customer pricing; a narrowing gap means less repricing runway. Occupancy drifting below 90% is the early warning. Non-same-store NOI from acquisitions and developments rounds out the picture: across the 606 properties in that pool, NOI grew 16.5% in 2025 as newer facilities leased up, providing a partial offset.
The NSA Acquisition
PSA closed its all-stock acquisition of National Storage Affiliates on 22 July 2026, at an enterprise value of roughly $10.5 billion. NSA holders received 0.14 of a PSA share each. The deal brought in more than 1,000 properties and 69 million rentable square feet across 37 states and Puerto Rico. Not all of it came across whole. Some 313 properties sit in a $3.2 billion joint venture with NSA's legacy limited partners, who hold about 80%; PSA holds the rest, runs them, and collects the management fees and the margin on tenant reinsurance, the contents cover sold alongside the unit.
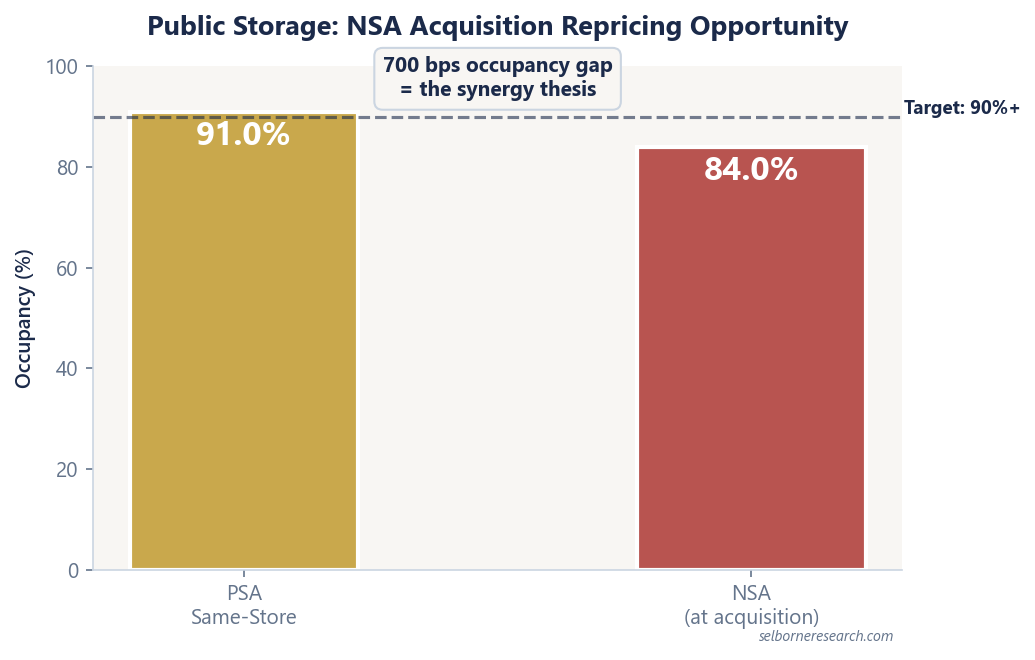
NSA's same-store occupancy ended 2025 at 84.0%, seven points below PSA's 91.0%. That gap is the case for the deal, and closing it means putting PSA's brand, pricing systems and marketing spend behind properties that were previously run by decentralised regional operators. Management expects $110 to $130 million of run-rate synergies within three to four years, from that repricing plus tenant reinsurance, operating efficiencies and overhead, worth $0.35 to $0.50 per share once fully realised. This is a margin and repricing story, not a growth-through-acquisition story. If the occupancy gap does not close, the synergy case goes with it. Separately, PSA has agreed to buy Public Storage Canada, 68 properties and 5.3 million square feet, for US$1.2 billion.
Peer Context
The self-storage sector is a three-way race between PSA, Extra Space Storage (EXR), and CubeSmart (CUBE). EXR absorbed Life Storage in 2023, which gave it depth in secondary and suburban markets and, until the NSA deal, the largest managed portfolio in the industry. CubeSmart runs a tighter portfolio concentrated in high-barrier coastal metros.
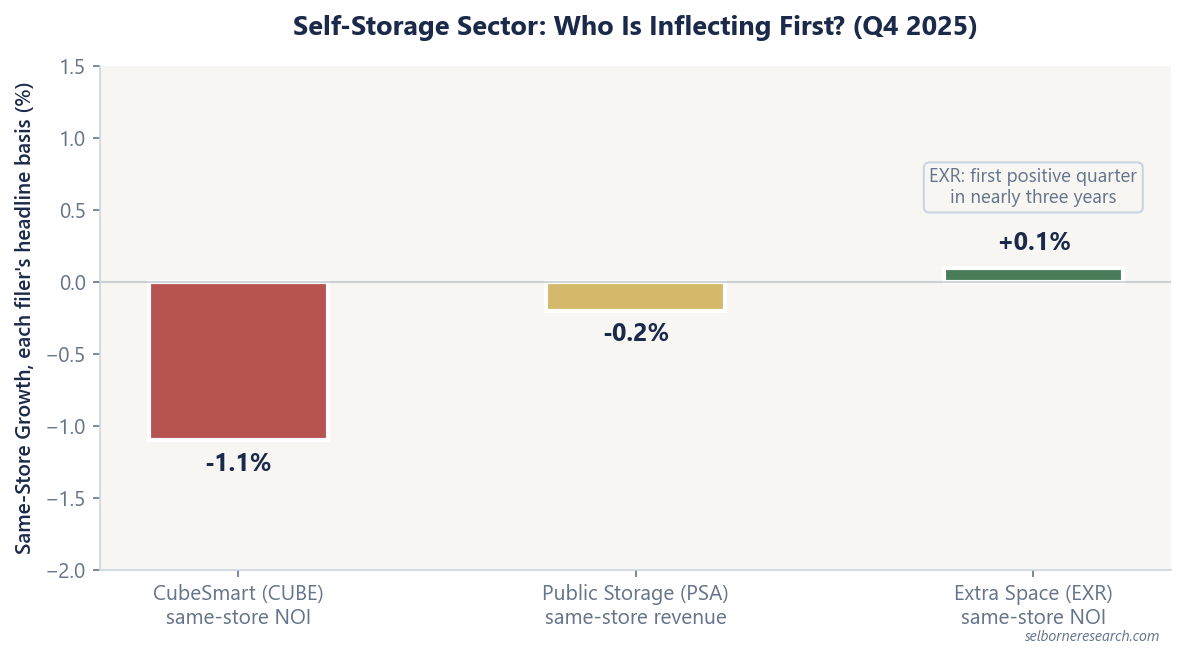
In Q4 2025, EXR posted its first quarter of positive same-store NOI growth in nearly three years (up 0.1%), a modest but symbolic inflection point. CUBE's Q4 same-store NOI fell 1.1%, dragged by a 2.9% rise in operating expenses against a 0.1% revenue decline. PSA's Q4 same-store revenue of -0.2% landed in between.
PSA's peer pitch is technology, not footprint. The PS4.0 initiative, announced alongside Q4 earnings, centres on an AI-driven omni-channel platform. Roughly 85% of customer transactions and interactions already run through PSA's website, app, chatbots and kiosks rather than a person in a leasing office. The bet is that better data science in pricing, targeted marketing, and customer conversion will widen the operating margin gap versus peers. EXR has its own tech stack, but CubeSmart lags on this front. If you believe revenue management sophistication is the differentiator in a commoditised product, PSA has the edge. If you think location quality matters more, CUBE's coastal focus is harder to replicate.
Risks
Sunbelt oversupply. Phoenix added over 2 million square feet of new storage space in 2025, second only to Atlanta. San Antonio is projected to lead US markets for new deliveries in 2026 with nearly 656,000 square feet. Austin, Las Vegas, and parts of Florida face similar pipelines. PSA has meaningful exposure to these markets, and new supply directly caps street rents and slows lease-up on existing facilities. In some Sunbelt submarkets, properties already trade at or below replacement cost.
ECRI fatigue is the hinge on the operating model. Existing tenants have to keep absorbing annual rate hikes without leaving. If the economy softens and tenants become more price-sensitive, or if competitors undercut street rates aggressively enough that switching costs no longer outweigh the savings, churn accelerates and occupancy drops. Watch quarterly move-out rates closely.
The same-store line is still shrinking. Move-in rents turned positive in the second quarter of 2026, but same-store revenue still fell 0.6% and same-store NOI 2.2%, because expenses grew and the sitting rent roll is being repriced off a low base. Guidance for the full year still runs from a 2.0% NOI decline to a 0.3% one. The inflection is in the newest cohort of tenants, not yet in the pool as a whole, and that takes several quarters to show up. If it stalls there, the multiple carries a growth assumption the numbers are not supporting.
NSA integration execution. Absorbing 1,000+ properties while transitioning NSA's historically decentralised structure of regional operating partners onto PSA's platform is operationally heavy, and the 313-property joint venture leaves PSA managing assets it mostly does not own. If integration costs overshoot or the occupancy lift takes longer than planned, 2027 earnings disappoint.
What the Valuation Reflects
At $328 a share in early August 2026, PSA trades at about 19x its 2025 core FFO of $16.97 and yields 3.7% on the $12.00 annual dividend. On the raised 2026 guidance midpoint the multiple is the same, because the company is not expected to grow this year. The ECRI engine still works, but it needs occupancy to hold above 90% and move-in rents to keep rising. The NSA portfolio is a genuine catalyst if PSA can close the occupancy gap on it. National supply came off its peak in 2025, with 51 million square feet delivered, about a fifth less than 2024, though the 2026 forecast of 55 million edges back up, roughly 2.6% of existing inventory. The national figure is the wrong one to watch anyway. Storage competes within a few miles, so it is the Sunbelt submarkets, still oversupplied, that set the street rent PSA can charge.
For a deeper look at how to evaluate self-storage REITs, including NAV-based valuation and cap rate benchmarks by property type, see our REIT Sector Primer.
Public Storage raises rent on tenants who will not move for a small increase. The primer builds that into a storage NAV.
The Excel model is the primer's two worked examples live across 13 sheets: change the cap rate, NOI growth or discount rate and the valuation moves.