Realty Income (O)
Realty Income research profile covering its diversified net-lease portfolio, property economics, valuation and dividend framework.
Educational analysis for professional use. This profile is not investment advice or a recommendation to buy or sell any security, and it is not personalised.
Snapshot
Business Overview
Realty Income has paid a monthly dividend since it was founded in 1969, more than 670 of them without a break. Not quarterly. Monthly. The company trademarked "The Monthly Dividend Company" and prints it on every press release. That sounds like marketing, but it has shaped the entire business: capital allocation, investor base, acquisition strategy. The headline record is 113 consecutive quarterly dividend increases, and it pays to know how that is counted. The company raises the monthly rate several times a year, often by a fraction of a cent, and the streak counts quarters in which the rate ended higher than the quarter before. It has raised the dividend 133 times since listing on the NYSE in 1994, at a compound 4.2% a year.
The portfolio spans 15,511 properties across the US, UK, and eight other European countries as of year-end 2025, leased to 1,761 tenants across 92 industries. That is scale few net lease REITs can match. The properties are overwhelmingly single-tenant: convenience stores, drugstores, dollar stores, restaurants, industrial warehouses, gaming venues. The tenant mix has been shifting away from traditional retail toward industrial and higher-credit anchors, though retail still dominates.
Occupancy stood at 98.9% as of December 31, 2025, up 20 basis points both sequentially and year-on-year. That number is not accidental. Triple-net leases make it expensive for tenants to walk away. They have absorbed build-out costs, signage, custom fit-outs. Switching costs are real, so vacancy tends to stay low.
How the Economics Work
The triple-net lease is the engine. A tenant signs a long lease and pays everything under it: rent, property taxes, insurance, structural maintenance. Across the portfolio there are 8.8 years of term still to run, on average. Realty Income collects the rent. That is it. The tenant handles property management, maintenance, and tax appeals. This is why the margins look extraordinary next to other REITs: adjusted EBITDA runs at about 95% of revenue. It is not that Realty Income runs buildings better than anyone else. It does not run them at all, so the costs that sit inside an office or apartment landlord's accounts never appear in its own. Comparing its margin to theirs compares two different things.
Built into each lease are contractual rent escalators, typically 1-2% per year. On a $1M annual rent, that is $10-20K more next year with zero effort. Multiply across 15,000+ properties and the organic growth, while modest per lease, adds up.
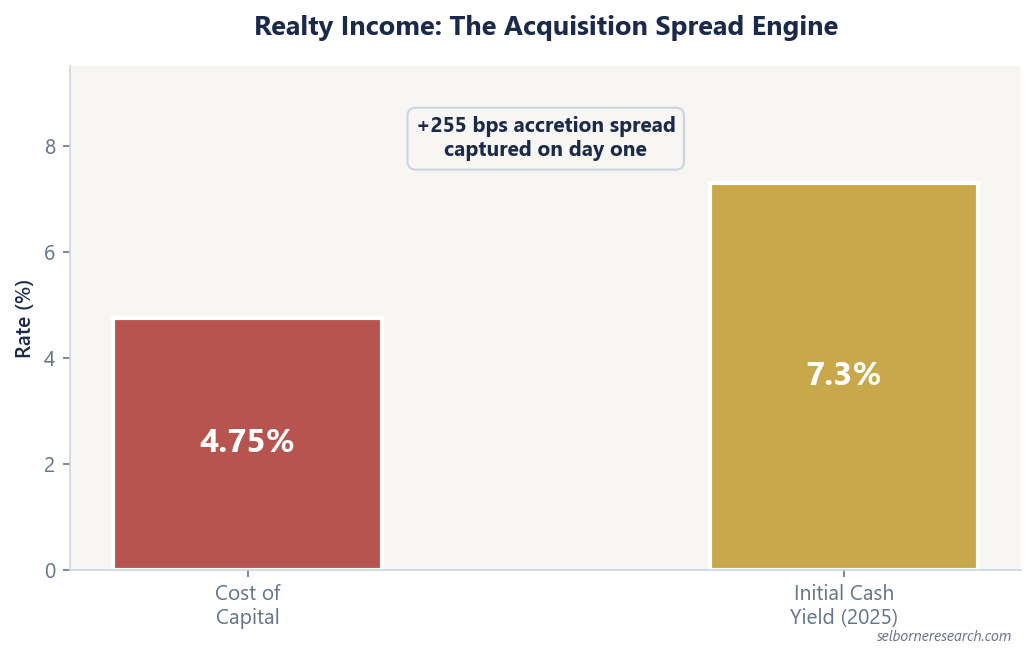
But the real growth driver is the acquisition spread. Realty Income buys property at an initial cash yield of around 7%, 7.3% across everything it bought in 2025, and funds it at a weighted average cost of capital nearer 5%. The gap is the whole engine, and the company reports it every quarter: roughly 220 basis points in the third quarter of 2025, on $1.4 billion deployed at 7.7%.
That spread is worth dwelling on, because it is where the share price feeds back into the business. Realty Income funds itself substantially with equity, so its cost of capital moves with its own dividend yield. A falling share price lifts the yield, lifts the cost of capital, and narrows the spread on every deal that follows. The growth rate is not something management sets. It is set partly by what the market will pay for the shares. In the third quarter of 2025 the company passed on about $2 billion of investment it could not fund at an accretive spread, which is the mechanism working as intended rather than a stumble.
The Spirit Realty Capital merger closed in January 2024 for $9.3B in stock. Spirit shareholders received 0.762 Realty Income shares per Spirit share, leaving Realty Income shareholders with 87% of the combined entity. The deal added roughly 2,000 properties with higher initial cap rates. Integration was seamless because there is nothing to integrate in a triple-net model. You are bolting on rent rolls, not merging operations.
Europe is now about a fifth of annualised base rent, up from nothing before 2019. The UK alone is 15%, with continental Europe spread across eight more countries. This is where the money is going: of the $6.3 billion Realty Income invested in 2025, $3.7 billion went to Europe, and it issued 1.3 billion euros of senior notes in June 2025 to help fund it. The attraction is a fragmented market with fewer institutional net lease buyers bidding cap rates down, which means wider spreads. The risk is a short track record. Note also that European leases are not longer than the American ones, whatever the region's reputation for long leases: the European book averages 8.0 years of remaining term against 8.6 for the group.
A third leg appeared in June 2026, when Realty Income committed up to $1.4 billion for a 45% interest in a joint venture with Cloud Capital and a global institutional investor, seeded with over $6 billion of Northern Virginia hyperscale data centres on 15 to 20 year triple-net leases. The structure matters as much as the asset. Realty Income is the minority partner and does not run the buildings: CloudHQ, Cloud Capital's operating arm, handles property and development management. So $1.4 billion of equity buys a share of the rent on a $6 billion portfolio it could not have bought outright, and it should be judged the way every other deal here is, on whether that rent clears the cost of the capital funding it.
What to Watch in the Financials
AFFO per share growth. This is the number, not portfolio size. A REIT that issues shares to buy buildings can grow its property count for years and go nowhere per share. One caution on the measure itself: Nareit defines FFO, but nobody defines AFFO, so each company decides what to add back. Realty Income's version is its own, and comparing it to a peer's is not quite like for like. Full-year 2025 AFFO came in at $4.28, up from $4.19 in 2024, so 2.1% growth. Guidance for 2026 is $4.44-$4.45, closer to 4%. Revenue grew faster: $1.49 billion in the fourth quarter of 2025 alone, up 11% year on year. The gap between the two is the share count, and it is the whole argument about this company.
AFFO payout ratio. Around 75%, being $3.217 of dividends paid per share against $4.28 of AFFO, and it has sat in the mid-70s for years (74.6% in 2024). It is not improving, and it does not need to. What it buys is roughly $1.06 per share of retained cash, close to $1 billion a year, which covers about a sixth of the $6.3 billion Realty Income deployed in 2025 without asking the market for anything. The other five-sixths comes from debt and new shares. If the ratio drifts above 80%, that cushion thins and the company leans harder on issuance at whatever price the market offers.
Acquisition volume and the yield it buys at. Realty Income deployed $6.3 billion in 2025 and has since raised its 2026 target to about $10 billion, roughly $9 billion of it on its own balance sheet. Read the yield rather than the volume. A cap rate is a price, not a return: 7.3% means the seller accepted a price of about fourteen times the first year's rent, and nothing about what the property will earn once the tenant's covenant is tested. If yields compress below 6.5% while funding costs hold, the volume can double and add nothing.
In the fourth quarter of 2025, Realty Income re-leased 341 leases at a 104.9% rent recapture rate, meaning the new rents came in slightly above the expiring ones; across the full year it was 103.9%. That is solid but unspectacular, and it is the number that tells you whether the rent roll has pricing power or merely stability.
Tenant credit quality. This matters more than occupancy, because a net lease only fails when the tenant does. There is no operating business at the property level to cushion the fall, just a rent cheque that arrives or does not. Investment-grade clients account for 32.2% of annualised base rent, so roughly two thirds of the rent comes from tenants nobody has rated or the agencies rate below investment grade. That is a choice, not an oversight: the company says it targets risk-adjusted returns rather than ratings, and unrated tenants pay higher cap rates. It also means the credit work is Realty Income's own. No single client is more than 3.3% of rent (7-Eleven, with Dollar General and Walgreens just behind) and the top 20 are 35.8%, eleven of them investment grade.
Debt and leverage. Realty Income carries A3/A- ratings from Moody's and S&P, among the highest in the net lease space, and that rating is worth real money: it is the cheap half of the cost of capital that sets the acquisition spread. Net debt to annualised pro forma adjusted EBITDAre sits at 5.4x, where it has been for two years. If credit spreads widen materially, the cost of rolling debt rises and the spread narrows from the other side.
Peer Context
The closest public comparison is NNN REIT, formerly National Retail Properties, which owns roughly 3,700 properties against Realty Income's 15,500. NNN carries a BBB+ rating rather than an A-, and a lower payout near 70% of AFFO, and it has raised its dividend every year since 1990. The trade-off is legible: NNN is purely domestic, purely retail and about a quarter of the size, so you get more dividend headroom and a higher yield in exchange for less diversification and no European deal flow. The weaker rating also means a dearer cost of capital, which is the same as saying NNN has to buy at a higher cap rate to earn the same spread.
STORE Capital, taken private by GIC and Oak Street (now Blue Owl) in 2023, was the other major comp. It traded at roughly 15x AFFO at the take-private price and had tighter leverage metrics than Realty Income. Its exit removed a useful public pricing anchor from the net lease space. Realty Income then absorbed Spirit Realty in early 2024, further consolidating the sector. If you are looking at net lease REITs today, the public field is smaller than it was two years ago, and Realty Income sits at the top by a wide margin in terms of scale.
Key Risks
Single-tenant retail exposure. Grocery is the largest industry at 11% of rent, then convenience stores at 9.6%, home improvement at 6.4% and dollar stores at 6.1%. E-commerce cannot kill a Dollar General or a 7-Eleven the way it killed Borders, and that is the point of the mix. But "needs-based" is a spectrum, not a category. Quick-service and casual-dining restaurants together are 8.6% of rent, and a consumer pullback reaches them long before it reaches the grocer.
European execution risk. With about a fifth of rent now from Europe, this is no longer a rounding error. Realty Income has built local teams, but the company's track record in continental European markets is short. Regulatory environments differ country by country. Tenant credit assessment is harder without deep local knowledge. UK energy costs and evolving building standards add complexity that does not exist in the US portfolio. A high-profile European tenant default would raise questions about the pace of international expansion.
Interest rate sensitivity. The A- rating gives Realty Income cheaper debt than most peers, but the model still depends on buying above its cost of capital, and that cost rises with rates and with its own share price. Dividends paid per share grew 2.9% in 2025 and 2.4% in 2024, which is roughly the pace of AFFO per share and not a coincidence. The dividend cannot outrun AFFO for long from a payout already in the mid-70s, so anything that squeezes the acquisition spread eventually shows up in the raises.
Scale disadvantage in growth. At $57 billion of market value and 15,500 properties, moving the needle gets harder every year. Realty Income now has to deploy $6-10 billion annually to grow AFFO per share in the low single digits, and each deal is a smaller fraction of a bigger base. Europe and the data-centre venture both widen the pool of things it can buy, which is the answer to the problem, and both carry the execution risks above.
Valuation Framework
Net lease REITs are usually framed on NAV and AFFO multiples, and one assumption drives the NAV side: the cap rate you apply to contractual rent. Core holdings on long leases to solid covenants are conventionally modelled around 6-6.5%; weaker secondary retail nearer 7-8%. A blend around 6.5% on normalised NOI is the usual starting point for a book of this quality. Move that blend by half a point and the value of the property falls about 8%; with debt at roughly a third of the balance sheet, the hit to net asset value per share is nearer 13%. That is why the cap rate deserves more argument than the rent forecast.
On an AFFO basis, 2025 delivered $4.28 per share and 2026 is guided to $4.44-$4.45. At the market value in the box above, the shares change hands near 14 times last year's AFFO. What decides the outcome is not where that multiple sits but whether AFFO per share keeps compounding once the acquisition spread narrows, and whether the European book earns what it was underwritten at.
Dividend growth of 2-3% on a yield above 5% is the income-and-growth mix of a mature net-lease compounder. Almost none of that growth comes from the leases themselves. Escalators of 1-2% roughly track inflation and no more, so the growth is bought, deal by deal, at whatever spread the market allows.
What the Screening Shows
Run Realty Income through a REIT quality screen and the picture is mixed. Occupancy at 98.9%, a balance sheet at A3/A- and a payout near 75% all score well. AFFO per share growth in the low single digits is middling, and it is the constraint everything else runs into. A yield above 5% screens well on income, but a screen will not tell you the thing that decides the next five years: two thirds of the rent comes from tenants that are unrated or rated below investment grade, and the growth rate is set partly by what the market pays for the shares.
The bull case rests on Europe widening the acquisition opportunity set at accretive spreads, the A- credit rating keeping funding cheaper than peers, and the monthly dividend compounding while occupancy and rent recapture hold. The bear case is that AFFO growth stays stuck in the low single digits while European expansion adds tenant-credit and regulatory execution risk that deal volume alone does not offset. Which reading holds turns on European deal quality and whether the acquisition spread stays wide enough to move AFFO per share at this scale.
Realty Income grows by buying rent at a spread. The primer runs that rent through a net-lease NAV.
The Excel model is the primer's two worked examples live across 13 sheets: change the cap rate, NOI growth or discount rate and the valuation moves.