Equinix (EQIX)
Equinix research profile covering retail colocation, interconnection, data-centre economics, churn and AFFO-based REIT valuation.
Educational analysis for professional use. This profile is not investment advice or a recommendation to buy or sell any security, and it is not personalised.
Snapshot
Interconnection Economics: Why It Matters
What interconnection actually buys is retention and pricing that drifts upward without new capital, which shows up in the growth rate rather than the multiple.
Plain colocation is renting rack space: a tenant leases 10 kilowatts, pays monthly, and can leave when the contract ends. Margins are decent but commoditising. Interconnection works differently. When two tenants both need to reach the same third party, they run a cable to each other inside the Equinix building instead of routing through the public internet. That saves them bandwidth cost, and every cable added raises what it would cost to move out, because leaving means re-establishing all of them somewhere else. The incremental cost to Equinix of the cross-connect itself is close to nothing: the power and the floor are already paid for.
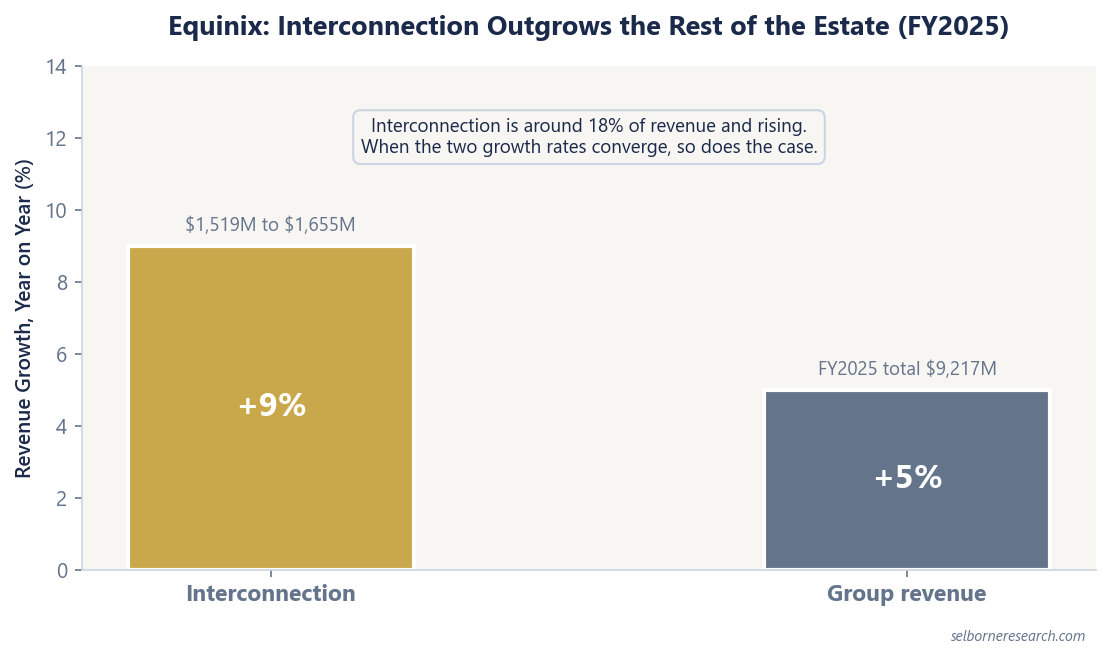
Interconnection revenue reached $1,655 million in 2025, up 9% on $1,519 million, against 5% growth for the business as a whole. It is around 18% of revenue and rising. Equinix crossed 500,000 deployed interconnections globally, the most in the industry, and gross bookings reached $1.6 billion for the year, up 27%. Bookings are the leading indicator: they tell you how much future recurring revenue is being locked in today. If you track one number across earnings calls, track interconnection growth against total revenue growth. When that gap closes, the case for owning Equinix rather than a cheaper landlord closes with it.
Business Overview
The customer base spans hyperscalers, enterprises, financial institutions, and content providers across a 280-site global footprint. MRR is monthly recurring revenue, the contracted rent running through the estate each month, and Equinix reports the share of it lost as a quarterly rate: 2.4% in Q1 2025, 2.6% in Q2, 2.3% in Q3, 2.2% in Q4, an average of 2.4% a quarter. Read the period carefully. Left running at that rate, churn takes out roughly 9% of the base over a year, so it cannot be set beside a tower REIT's 1-2% annual churn and treated as the same order of number.
Roughly 60% of Equinix's largest Q4 2025 deals were driven by AI workloads. The xScale programme, a series of hyperscaler-targeted joint ventures, is expected to represent more than $23 billion of total investment and roughly 2 GW of power when fully built out. Equinix does not own most of that. It holds 25% of the US venture, with CPP Investments and GIC taking 37.5% each, and similar minority positions elsewhere. That is a deliberate capital allocation choice you should evaluate: it caps how much of the hyperscale economics reaches Equinix shareholders, and in exchange the capital and the construction risk sit largely outside the REIT's own balance sheet.
What to Watch in the Financials
Interconnection revenue vs colocation. This is the mix that drives the thesis. Interconnection growing at 8-10% while the rest of the estate grows low single digits is what lifts group revenue growth above what a landlord renting floor space would manage. If the two converge, Equinix is a landlord. Equinix does not publish gross margin by revenue line, so this is a mix and growth read, not a margin one.
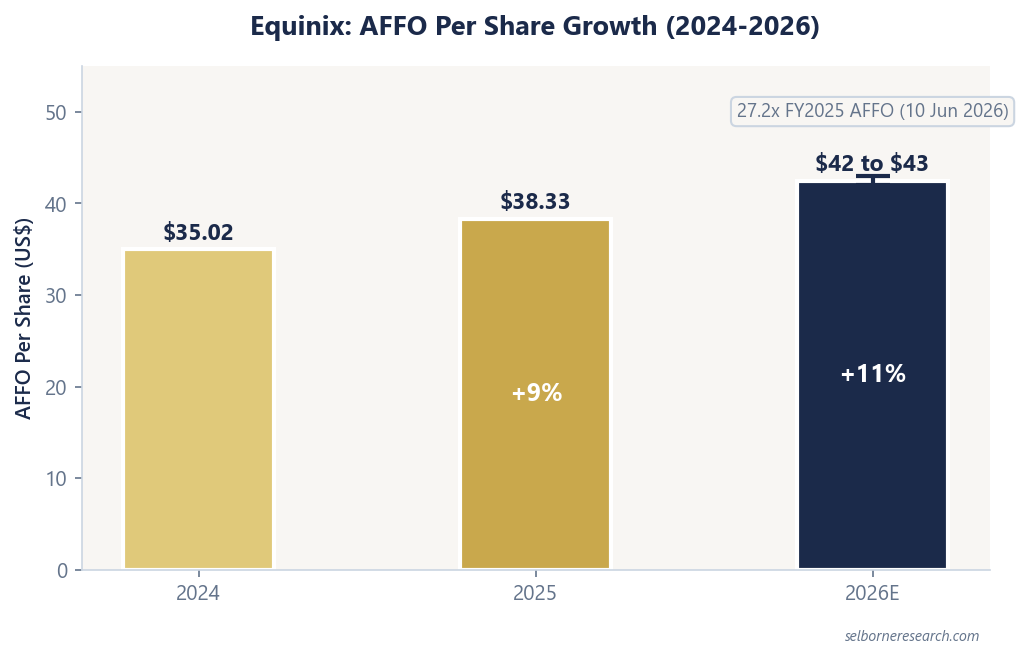
AFFO per share and MRR churn. FY2025 AFFO of $38.33 per share, up from $35.02 in FY2024, puts the shares on about 27.2x (10 Jun 2026), inside the roughly 22x to 28x band data centre REITs have been trading in. AFFO is worth a caution: Nareit defines FFO but has never defined AFFO, so each company decides for itself which spending counts as maintaining an asset and which counts as improving it. In a data centre that line is genuinely hard, because a hall stripped out and re-powered for denser racks can be booked either way, and the two answers give different AFFO from identical cash. Read the reconciliation before ranking anyone on the multiple. On churn, the 2.4% is per quarter; compare it to tower tenant-billings churn only with the definitions set out in the churn guide.
Same-store revenue growth. Equinix reports MRR growth by region, and it grew 10% year-on-year in Q4 2025. What you want from it is whether existing facilities are earning more per square foot, or whether the growth is coming entirely from new builds.
Power cost as a percentage of revenue. Data centre REITs are more power-intensive than any other REIT sub-sector. Equinix uses a mix of power pass-through arrangements and long-dated PPAs to manage exposure, and cut its global average power usage effectiveness to 1.39 in 2024, a 6% improvement in a year. PUE is total electricity drawn divided by the electricity that reaches customer equipment, so 1.39 means 39% of overhead, mostly cooling, on top of every unit of useful power. But electricity costs remain a meaningful drag on margins when pass-through lags spot price moves. If you are modelling Equinix, stress-testing power cost assumptions by 10-15% is a useful exercise.
Peer Context: Equinix vs Digital Realty
Digital Realty (DLR) is the closest comparable. It reported FY2025 Core FFO per share of $7.39 (headline earnings metric; filed AFFO was $6.55 per share) and FY2025 total bookings of $1.2 billion annualised GAAP rental revenue at 100% share. Cloud migration and AI compute demand lift both names; content delivery is a smaller third leg. The differences are strategic.
Equinix has higher interconnection density per facility and a larger share of revenue from interconnection services. Digital Realty skews more toward wholesale and hyperscale leasing, with interconnection contributing a smaller share of bookings. Equinix's revenue is stickier on a per-customer basis; Digital Realty captures larger individual lease commitments.
The headline multiples look like a gap and are not one. Equinix's 27.2x is struck on AFFO. A Core FFO multiple stops short of the AFFO deductions, so a peer quoted on Core FFO looks lower than it is; put it on the same AFFO basis and the apparent discount largely closes. That gap is a units problem, not a valuation view. What the market is actually paying Equinix for is growth with less execution attached: revenue that reprices upward inside buildings that already exist, against a hyperscale backlog that still has to be built and energised. The colocation vs hyperscale guide works the comparison through in full.
Risks
Power cost exposure. Equinix's electricity bill, as a proportion of operating costs, is unusually high relative to other REIT sub-sectors. An industrial REIT's power costs are a rounding error; for Equinix, they are a material line item. Pass-through arrangements help, but they do not fully insulate margins during sharp energy price spikes, and renegotiating PPAs takes time.
Hyperscaler insourcing. Microsoft, Google, and Amazon are all building their own data centres at scale. Equinix's xScale JVs serve these customers today, but the risk is that hyperscalers eventually bring enough capacity in-house to reduce third-party demand. This would not eliminate Equinix's enterprise and interconnection business, but it would take the top off group bookings, which grew 27% across 2025 and 42% year-on-year in the fourth quarter alone.
Accounting complexity. Equinix's financials include JV consolidation adjustments, power pass-through normalisation, and constant-currency reconciliations. FY2025 revenue grew 5% as reported and 6% normalised and in constant currency, and the gap between the two moves with the dollar. It is a point in a good year and can be wider. If you are screening on headline growth without knowing which basis you are looking at, you may be comparing unlike numbers against simpler REITs. The REIT screening checklist covers what to normalise for.
The Bull and Bear Cases
Bull case: Interconnection keeps growing at 8-10% while the rest of the estate holds steady, and adjusted EBITDA margin climbs from the 51% guided for 2026 toward the 53%-plus management targets by 2029. AI workloads sustain elevated bookings ($1.6 billion in 2025, up 27%). AFFO per share is guided to roughly $42-43 for 2026, and at the 9-12% a year the company says it can hold beyond that, 2027 lands near $47-48. The dividend, raised 10% to $5.16 a share for 2026, grows with it. On that basis you are buying the growth rate, not paying for the multiple.
Bear case: Interconnection growth decelerates to mid-single digits as the installed base matures, so the interconnection-versus-colocation gap no longer separates Equinix from Digital Realty on economics. Power costs spike and pass-through lags compress AFFO margins by 100-200 basis points. Hyperscalers pull back on third-party leasing as their own builds come online, and bookings growth falls back toward the colocation run-rate.
Infra & Digital REIT Sector Primer
Interconnection makes an Equinix site harder to leave than a cheaper one. The primer puts that stickiness into an AFFO valuation.
The Excel model is the primer's two AFFO valuations live across 10 sheets: change the escalators, churn or the 10-year Treasury and the valuation moves.