Churn in Tower and Data Centre REITs
Compare tower and data-centre churn metrics, their definitions and why the reported percentages are not directly comparable.
Educational analysis for professional use. This guide is not investment advice or a recommendation to buy or sell any security, and it is not personalised.
Two Churn Numbers, Two Different Clocks
Churn is the rent you lose when tenants leave, and the single most expensive mistake a reader can make with it is to line two of them up in a column.
Tower REITs quote churn over a year. Equinix quotes it over a quarter. Its 2.4% therefore sits four periods inside a tower’s 2%, and anyone who reads the two as neighbours concludes that colocation is nearly as sticky as a cell tower, which is wrong by a factor of four or five. That is the first thing to check on any churn figure: the period, then the base it is measured against, then what has been left out of it.
The exclusions matter as much as the periods. Two of the three US tower REITs report a headline churn rate that deliberately omits the largest tenant loss the sector has seen in a decade.
Tower Churn Is Annual, and It Arrives in Blocks
| Company | Churn metric (annual) | FY2025 rate | What it measures |
|---|---|---|---|
| Crown Castle (CCI) | Non-renewals, Sprint and DISH excluded | 0.7% | $27M against roughly $3.9B of tower billings |
| SBA (SBAC) | Regular churn, domestic | 1.3% | Prior core leasing revenue basis |
| American Tower (AMT) | Tenant billings churn | ~2% | Billings lost ÷ prior-year billings |
| SBA (SBAC) | Regular churn, consolidated | 2.6% | Blends domestic and international |
| SBA (SBAC) | Regular churn, international | 7.1% | Prior core leasing revenue basis |
The domestic band is roughly 1% to 2% a year. Crown Castle’s own 10-K gives the same range as its historical non-renewal experience, which is a useful confirmation that the band is the industry’s and not one analyst’s invention.
Where tower churn differs from almost every other recurring-revenue business is that it is not a steady drip. A tower REIT in one country rents to four or five national carriers. Nothing happens for years, then two of them merge, the combined company finds itself paying rent on two overlapping networks, and it spends the next several years switching off the duplicate sites. The rent does not decay. It disappears in a block, years after the merger was announced, and then the loss stops.
That is why Crown Castle reports its churn twice over. The Sprint and T-Mobile consolidation took roughly $200 million of tower rent out in 2025, about 5% of the billings base on its own. The 0.7% headline is what was left after that was set aside, plus the separate DISH termination. Add the excluded rent back and Crown Castle’s tower churn in 2025 was closer to 6% than to 0.7%, and its site rental revenue was falling rather than compounding.
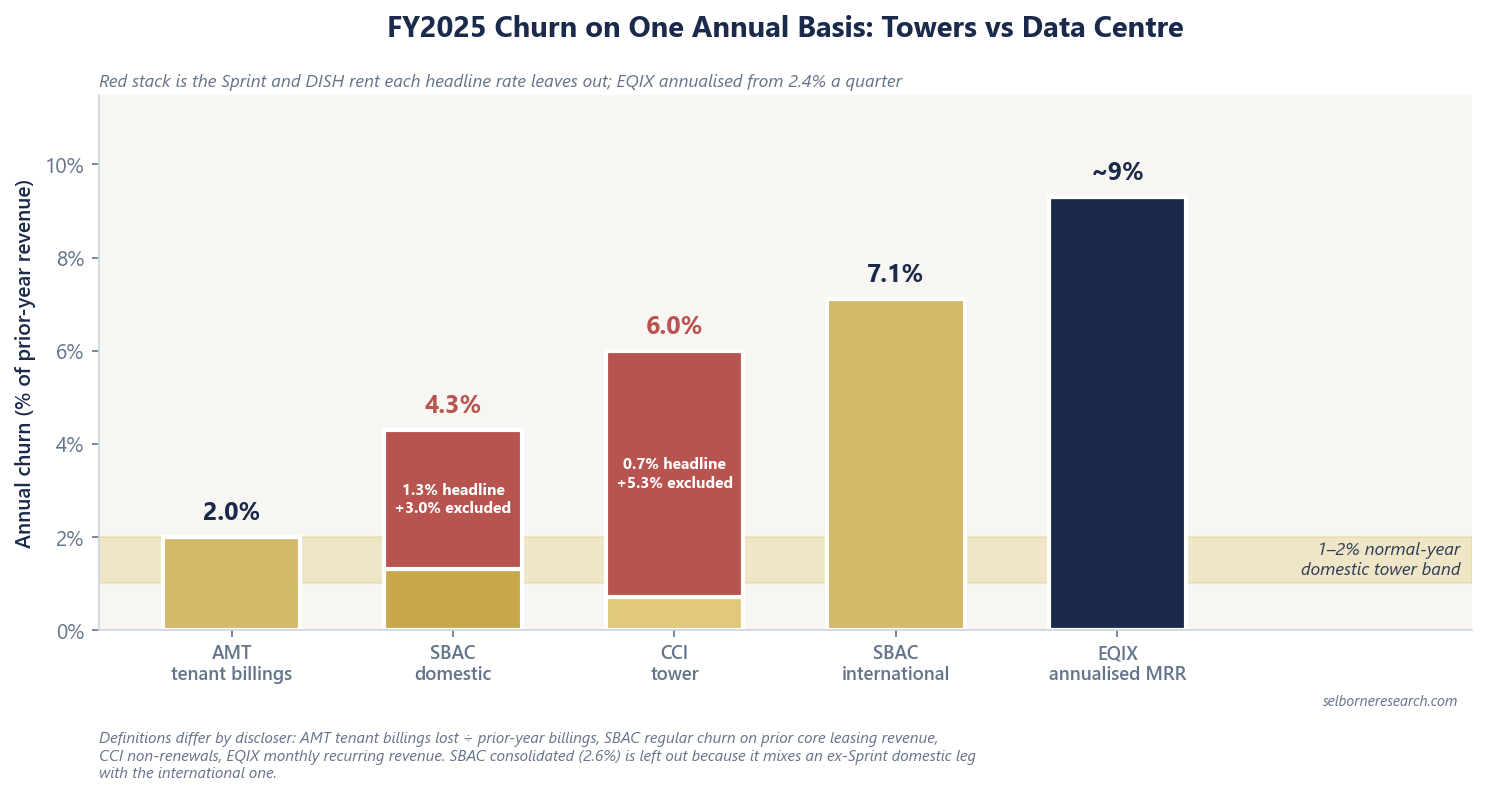
Neither presentation is dishonest. The excluded figure genuinely tells you what a normal year looks like once the merger has worked through, which is what a forecast needs. But it is not what the company lost, and a screen that ranks Crown Castle as the stickiest of the three on 0.7% has ranked it on a number the company itself does not claim as its experience.
The Definitions Are Not Interchangeable Either
Even with the period matched and the exclusions understood, the three filers measure different things. American Tower divides tenant billings lost by prior-year tenant billings, a retention measure across the whole rent roll. Crown Castle measures non-renewals against a cleaned billings base. SBA Communications discloses regular churn on prior core leasing revenue and is the only one to split domestic from international, where 7.1% is more than five times the domestic 1.3%.
So a 2.6% SBA figure and a 0.7% Crown Castle figure are not the same animal, even though both are labelled tower churn.
Data Centre Churn Is Quarterly, and It Is Continuous
Equinix reports average MRR churn per quarter. MRR is monthly recurring revenue, the contracted rent running through the estate each month, and the churn figure is the share of it lost in a three-month period.
| Quarter FY2025 | MRR churn |
|---|---|
| Q1 | 2.4% |
| Q2 | 2.6% |
| Q3 | 2.3% |
| Q4 | 2.2% |
| FY2025 average (quarterly) | 2.4% |
Put that on a tower’s clock before comparing. Losing 2.4% of the base each quarter and keeping the rest leaves 0.976 to the fourth power, or 90.7%, so a year at that rate costs about 9% of the recurring revenue base. Against a tower’s 1% to 2%, colocation revenue is roughly five times as mobile, not marginally worse.
The reason is structural rather than a failure of management. Colocation sells to hundreds of customers on contracts of a year or two, so some fraction is always leaving; churn is continuous and granular where a tower’s is lumpy and event-driven. What holds it down is interconnection. Once a customer’s traffic runs through a dozen cross-connects to suppliers and partners in the same building, leaving means rebuilding that web somewhere else, and the denser the ecosystem the less often anyone does. Watch interconnection revenue and cross-connect counts, not the churn rate on its own. For how colocation economics differ from hyperscale, see colocation vs hyperscale.
Worked Example: Churn Is Only One Leg of Growth
A churn rate on its own says nothing about which way revenue is going, because churn is netted against what replaces it. On towers the identity is escalator, less churn, plus colocation and amendments. Take the first two legs at a 3% escalator:
| Peer | Escalator − churn |
|---|---|
| CCI | 3.0% − 0.7% = 2.3% |
| SBAC domestic | 3.0% − 1.3% = 1.7% |
| AMT | 3.0% − 2.0% = 1.0% |
Read that table and Crown Castle wins. Two things say otherwise. Its 0.7% excludes the Sprint and DISH rent, and putting that back turns the 2.3% negative. SBA’s 1.3% is built the same way: its supplemental prints another 3.0% of Sprint churn on the same domestic base, so the rent it actually lost at home was 4.3%. And the missing third leg is doing most of the work: American Tower reported 4.2% organic tenant billings growth in the US and Canada in FY2025, which is 3.0% of escalator less 2.0% of churn plus about 3.2 points of colocation and amendments. The colocation leg is larger than the escalator net of churn.
American Tower’s consolidated figure was higher again, at 5.1%, but that gap is not better colocation. Most of its sites are outside the US and Canada on leases indexed to local inflation, which escalate well above 3%. The lease escalators guide works the identity through segment by segment.
The lesson to carry off the page: a low churn rate is not automatically a good sign. It is good only alongside pricing power and new business. A landlord with no churn and no amendments grows at its escalator and no faster.
The International Premium
SBA’s 7.1% international regular churn against 1.3% domestic is the clearest filed split anyone publishes. American Tower does not disclose the same split, but with roughly 72% of its sites outside the US and Canada, its consolidated ~2% is a blend of two very different rates rather than a reading on either.
So when you model an internationally weighted tower REIT, use the domestic rate only for the domestic rent, and stress the international exposure separately. Crown Castle is the one name where a single domestic rate is the whole answer, having sold its fibre and small-cell businesses on 1 May 2026 to become a pure US tower company.
Where Churn Shows Up in the Price
Churn subtracts directly from organic growth, and organic growth is what the multiple is paying for. Tower REITs traded in a P/AFFO band of roughly 15 to 22 times in June 2026, with SBA around 16.0×, American Tower 17.8× and Crown Castle 21.2×. Model churn at 1.5% when the portfolio is running at 2.0% and every year of the AFFO path is half a point too high, compounding as it goes, so the multiple you are willing to pay is struck against a growth rate the company is not achieving.
Three questions settle most of it. Over what period is the rate quoted. What has been excluded from it. And what is replacing the rent that left. The SBA Communications, Crown Castle and Equinix profiles carry the FY2025 detail to check an assumption against.
Infra & Digital REIT Sector Primer
Churn subtracts straight from organic billings growth. The primer feeds that spread into a two-stage AFFO valuation.
The Excel model is the primer's two AFFO valuations live across 10 sheets: change the escalators, churn or the 10-year Treasury and the valuation moves.
Frequently Asked Questions
- What is churn for a tower REIT?
- Churn is the rent lost when a tenant does not renew or cancels, measured over a full year and expressed against the prior year's billings. American Tower divides tenant billings lost by prior-year tenant billings, about 2% in FY2025. SBA Communications reports "regular churn" on prior core leasing revenue, splitting it domestic, international and consolidated. Crown Castle reports non-renewals with the Sprint and DISH departures stripped out, which is why its 0.7% headline sits below the 1% to 2% range its own 10-K gives as normal. Read what has been excluded before you use any of them.
- What is a normal churn rate for US tower REITs?
- Roughly 1% to 2% a year on domestic portfolios, which is also the range Crown Castle's 10-K names as its historical non-renewal experience. Consolidated figures for internationally weighted portfolios run higher: SBA reported 2.6% consolidated and 7.1% international in FY2025 against 1.3% domestic. The band describes a normal year. It does not cover a carrier merger: Crown Castle lost about $200 million of tower rent to the Sprint and T-Mobile network consolidation in 2025 alone, and that sits outside the 0.7% it headlines.
- How does data centre churn differ from tower churn?
- Start with the clock, because the two are quoted over different periods. Equinix reports average quarterly MRR (monthly recurring revenue) churn, 2.4% for FY2025. Tower churn is annual. Left running at 2.4% a quarter, Equinix would shed about 9% of its recurring revenue base over a year, so 2.4% cannot be set against a tower REIT's 1% to 2% and read as a similar number. The causes differ too: tower churn arrives in blocks when carriers merge and switch off duplicate sites, while colocation churn is continuous, granular, and held down by the cross-connects a customer would have to rebuild elsewhere.
- Why does international tower churn run higher than domestic?
- SBA Communications reported FY2025 regular churn of 1.3% domestic against 7.1% international on prior core leasing revenue, more than five times the rate. International portfolios carry different tenant mixes, shorter average lease terms in some markets, and more frequent carrier consolidation, since emerging markets have been through waves of it. American Tower does not publish the same split, but with roughly 72% of its sites outside the US and Canada its consolidated ~2% blends the two.