Capacity Factors by Generation Technology
Capacity factor definition, planning norms by technology (nuclear 91%, wind 34%, solar 24%, CCGT 58%), and EIA CY2024 actuals as a cross-check.
Educational analysis for professional use. This guide is not investment advice or a recommendation to buy or sell any security, and it is not personalised.
Capacity Factor Tells You How Much a GW Actually Generates
Nameplate megawatts overstate output for wind and solar and understate the value of baseload nuclear. Capacity factor closes that gap: actual generation divided by what the plant would produce at full output every hour of the year.
Capacity factor = generation (MWh) ÷ (nameplate MW × 8,760 hours)
Long-term average (LTA) generation estimates all flow from this identity. Get the factor wrong and every downstream revenue line moves, including contracted PPA cash flows priced in the PPA versus merchant guide.
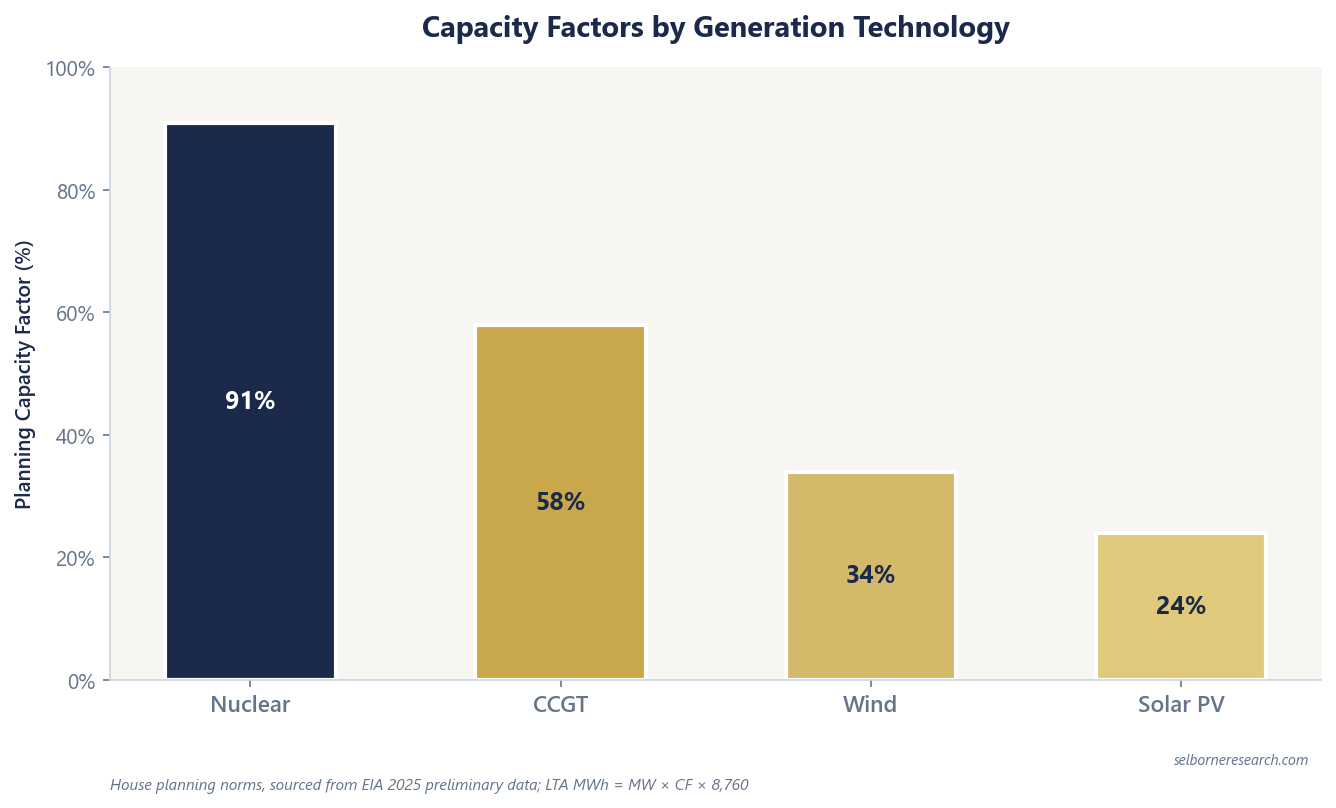
Planning Norms vs EIA Actuals
Models and guides use planning norms sourced from EIA 2025 preliminary data. EIA CY2024 actuals are the cross-check.
| Technology | Planning norm | EIA CY2024 actual |
|---|---|---|
| Nuclear | 91% | 90.8% |
| Combined-cycle gas | 58% | 60.5% |
| Onshore wind | 34% | 34.3% |
| Utility-scale solar PV | 24% | 23.2% |
Planning norms sit close to actuals for nuclear and wind. Solar planning (24%) is slightly above CY2024 (23.2%); CCGT planning (58%) is below CY2024 (60.5%). Use planning norms for through-cycle valuation; cite actuals when explaining historical fleet performance.
LTA Generation Formula
For any asset or fleet:
LTA generation (MWh) = nameplate MW × capacity factor × 8,760
Brookfield Renewable’s calendar 2025 proportionate LTA total was 21,107 GWh, reported on a proportionate (economic-ownership) basis rather than against the fleet’s 47.2 GW gross operating capacity, so the two figures do not divide into a single capacity factor. Technology-level planning norms are for building up fleet estimates from nameplate MW, not for reverse-engineering a filed proportionate GWh number.
Worked Example: 1 GW Nuclear vs 1 GW Solar
Using planning norms on 1,000 MW nameplate:
| Technology | CF | LTA generation (GWh) |
|---|---|---|
| Nuclear | 91% | 1,000 × 0.91 × 8,760 ÷ 1,000 = 7,972 |
| Solar PV | 24% | 1,000 × 0.24 × 8,760 ÷ 1,000 = 2,102 |
| Ratio (nuclear ÷ solar) | ~3.8× |
One gigawatt of nuclear produces roughly 3.8× the annual megawatt-hours of one gigawatt of solar at these planning norms. That is why baseload operators command around-the-clock offtake premiums. Constellation Energy owns 22.1 GW of nuclear (FY2025, pre-Calpine standalone) and guides ~25% of expected baseload clean MWh under long-term agreements in its 2026 forward deck. The Crane restart (~835 MW, 20-year Microsoft PPA) is a live example of baseload capacity factor translating into contracted revenue.
The planning PPA anchor is $30/MWh: roughly the average price LBNL records for US projects that came online in 2024, mostly on contracts signed in 2020-22. Contracts signed in 2023-24 priced higher, so treat it as a teaching mark, not a new-contract quote. At that mark:
| Asset | LTA GWh | Revenue at $30/MWh |
|---|---|---|
| 1 GW nuclear | 7,972 | ~$239M |
| 1 GW solar | 2,102 | ~$63M |
Same nameplate, different output, different contracted revenue at the same PPA price.
Where Capacity Factor Enters Valuation
Contracted yieldcos. Clearway’s ~10.1 GW wind/solar/BESS fleet sold 19,753 thousand MWh in FY2025 (wind 10,528k; solar 9,225k). Capacity factor on each site drives whether CAFD covers the ~83% derived payout.
Merchant CCGT. The illustrative merchant worked example runs 5.0 GW gas/nuclear with 58% CCGT capacity factor where relevant, PJM planning energy $50/MWh and capacity $250/MW-day. Output volume sets the energy revenue leg in the spark spread guide.
Developers. AES reports 34.7 GW gross capacity (54% renewables) with a 12.0 GW contracted backlog. Pipeline MW is nameplate; LTA revenue requires a technology-specific capacity factor before applying PPA prices.
What Matters Most
Capacity factor converts GW into GWh. The planning norms (91 / 58 / 34 / 24) are the inputs; EIA CY2024 actuals confirm they are in the right ballpark. For any LTA build, write out MW × CF × 8,760 before touching PPA revenue or merchant spark spreads. A 5-point error on solar CF shifts 1 GW output by ~438 GWh, or ~$13M at a $30/MWh contracted mark.
Renewables & IPPs Sector Primer
A multi-period DCF splits contracted PPA years from the merchant tail, pricing each off realised power price and term, then checks the value against spark spread and CAFD.
The Excel model is the primer's two archetype builds live across 10 sheets: a multi-period DCF with a contracted-or-merchant toggle, step-down discount rates for the PPA term and the merchant tail, a spark-spread build for the merchant case and a CAFD-and-payout bridge for the yieldco. Change the realised PPA price, the contracted discount rate or the merchant spread and the value per share moves; the premium and payout sheets update alongside it. It also splits the contracted premium into the part the pipeline explains and the part contract quality explains, splits the PV between contracted years and the merchant tail, and reads EV per kW on both archetypes.
Frequently Asked Questions
- What is capacity factor in power generation?
- Capacity factor is actual generation divided by the maximum possible output if a plant ran at full nameplate capacity every hour of the year: generation ÷ (nameplate MW × 8,760 hours). A 1 GW plant at 50% capacity factor produces 4,380 GWh annually. The metric normalises output across technologies with different run profiles.
- What are typical capacity factors by technology?
- Planning norms we use: nuclear 91%, combined-cycle gas 58%, onshore wind 34%, utility-scale solar PV 24%. EIA CY2024 actuals cross-check: nuclear 90.8%, CCGT 60.5%, wind 34.3%, solar 23.2%. Models and guides use planning norms for LTA generation math; actuals validate but do not replace them.
- Why does nuclear capacity factor matter for data-centre PPAs?
- Around-the-clock load needs baseload output. At planning norms, 1 GW of nuclear produces roughly 3.8× the annual MWh of 1 GW of solar (7.97 TWh vs 2.10 TWh). Constellation Energy operates 22.1 GW of nuclear (FY2025) and discloses ~25% of expected baseload clean MWh under long-term agreements in its 2026 forward deck, with the Crane restart (~835 MW) backed by a 20-year Microsoft PPA.
- How do capacity factors feed LTA generation estimates?
- Long-term average (LTA) generation in MWh equals nameplate MW × capacity factor × 8,760 hours. Brookfield Renewable's 47.2 GW operating fleet at blended norms feeds proportionate LTA GWh (21,107 GWh total in calendar 2025, with 18,736 GWh contracted). Wrong capacity factor assumptions shift revenue at fixed PPA prices and distort EV/EBITDA on contracted yieldcos.