Valuing Concessions: the Finite-Life DCF
Finite-life concession DCF to expiry with zero terminal value, the built 8.21% WACC discount rate, and why perpetuity EV/EBITDA misprices remaining life.
Educational analysis for professional use. This guide is not investment advice or a recommendation to buy or sell any security, and it is not personalised.
Zero Terminal Value Is the Starting Point
A toll road or airport concession is not a perpetual asset. The operator earns cash flows only until contractual expiry (or the end of the current regulatory period where no single expiry exists). At that point, infrastructure reverts to the grantor under IFRIC 12. Terminal value in a concession DCF is zero.
That single assumption separates concession valuation from a generic corporate DCF or a REIT NAV build. EV/EBITDA can still screen comps as a cross-check; the DCF to contractual expiry does the real work. Demand-risk toll roads typically screen at ~12-16×; regulated or availability-style concessions at ~10-14×. Those bands assume perpetuity unless you adjust for remaining life.
What Goes Into the Cash-Flow Build
Three drivers stack on top of each other before you discount:
| Driver | What it does | Typical anchor |
|---|---|---|
| Traffic / volume | Trips, vehicle-km, or passengers | Mature EMEA toll roads ~1.0× GDP; developed airports ~1.3× income (planning defaults) |
| Tariff escalators | CPI floors, fixed steps, or dynamic pricing | See toll escalators guide for deed-level examples |
| Concession life | Hard stop on the DCF horizon | Filed span ~6 years (Vinci Escota) to ~73 years (Ferrovial 407 ETR) |
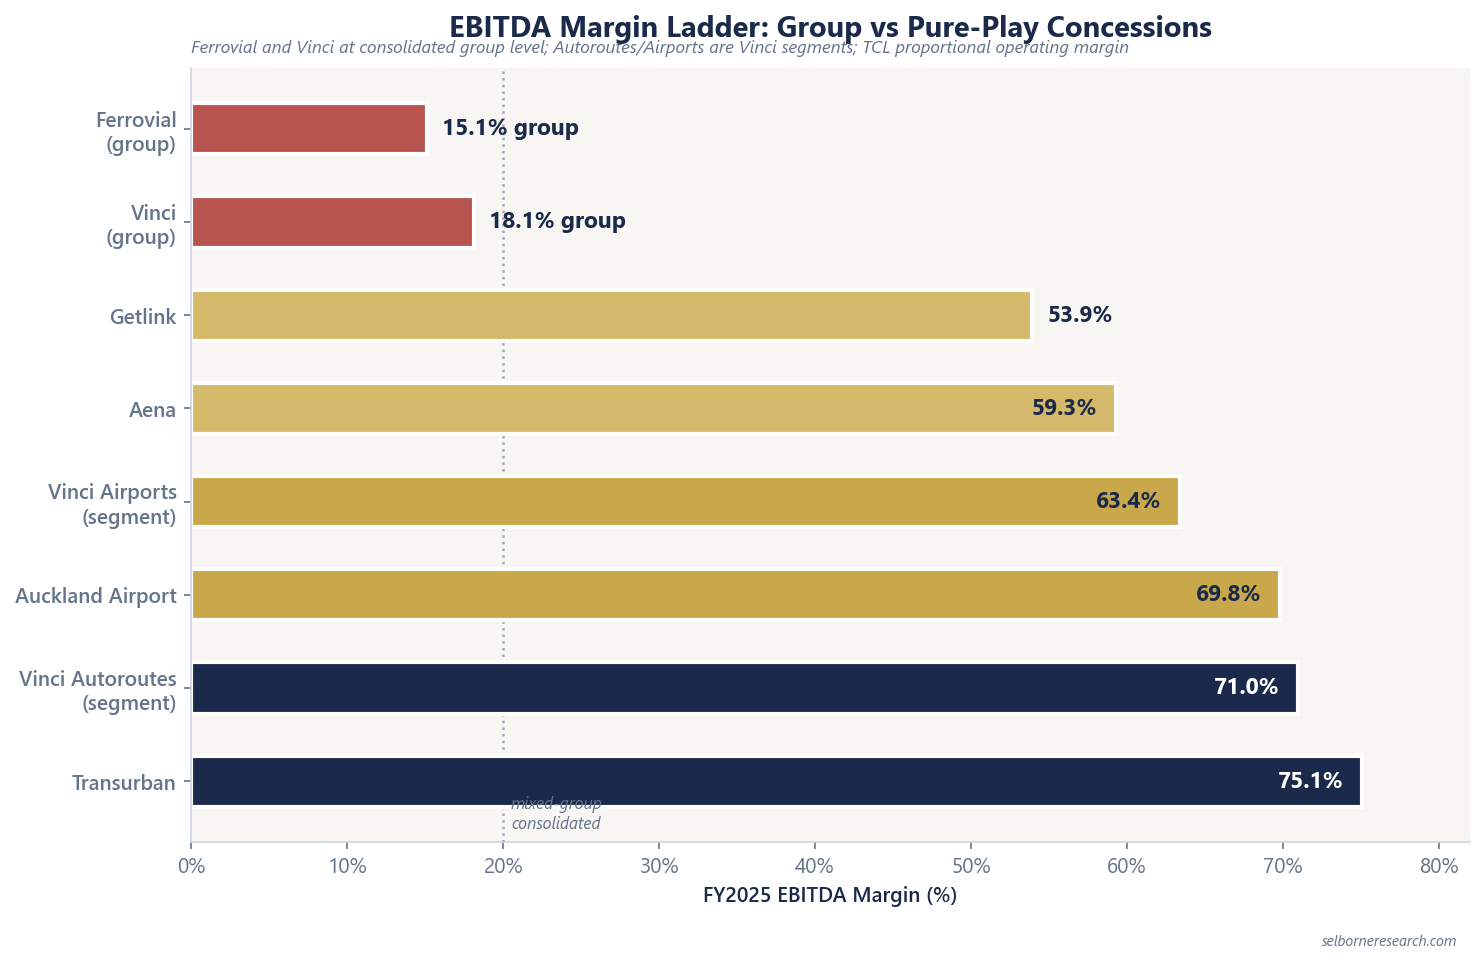
Segment EBITDA margins from FY2025 filings show why you cannot apply a group multiple to a pure toll asset: Transurban prints 75.1% proportional operating margin; Ferrovial group is ~15.1% because construction and services sit in the same consolidation.
Why Perpetuity Multiples Misprice
Apply a mid-case 13.0× EV/EBITDA anchor (illustrative demand-risk default) to A$500m year-zero EBITDA and you get A$6,500m enterprise value as if cash flows never end.
Run the same EBITDA through a finite-life DCF and the answer depends heavily on years remaining. With the 8.21% discount rate sitting well above the 4.55% combined growth rate, distant cash flows lose value fast, so the perpetuity screen overstates most of the comp set, not just the short-dated end:
| Remaining life | Illustrative EV/EBITDA (same growth, discount, tax and maintenance assumptions) | vs 13.0× perpetuity screen |
|---|---|---|
| ~6 years (short-dated) | ~3.6× | Perpetuity overstates, here by more than 3.5× |
| 30 years (mid-life urban case) | ~12.3× | Perpetuity still overstates, now by only ~5.5% |
| ~73 years (ultra-long) | ~17.6× | Perpetuity understates ultra-long concessions, here by ~26% |
The concession life guide maps expiry dates across the comp set. Getlink Channel Tunnel (~61 years to 2086) is the clean mono-asset case for a single-asset DCF with no terminal value.
Worked Example: 30-Year Urban Toll Road
Illustrative worked example parameters (Jun 2026, anchored to Transurban margin and Ferrovial leverage):
| Input | Value |
|---|---|
| Concession life remaining | 30 years |
| Year-zero EBITDA | A$500m |
| EBITDA margin | 75% (matches Transurban FY2025 75.1%) |
| Traffic growth | 2.0% p.a. (1.0× GDP in a 2% GDP case) |
| Toll escalator | 2.5% p.a. CPI-linked |
| Combined EBITDA growth | ~4.55% p.a. = (1 + 2.0%) × (1 + 2.5%) − 1 |
| Discount rate | 8.21% nominal post-tax WACC (built, see FAQ) |
| Maintenance capex | 8% of revenue |
| Tax rate | 25% |
| Net debt / EBITDA | 4.0× → A$2,000m net debt |
Step 1: Project EBITDA for years 1–30 with EBITDAt = A$500m × (1.0455)t, strip 8% of revenue for maintenance capex and 25% tax to get free cash flow. Year-one cash flow: A$350.2m.
Step 2: Discount each year’s after-tax, after-maintenance cash flow at 8.21% and sum. Present value to expiry ≈ A$6,158.9m (~12.3× year-zero EBITDA).
Step 3: Subtract net debt A$2,000m → equity value ≈ A$4,158.9m.
Cross-check: A blind 13.0× screen on the same EBITDA gives A$6,500m EV, about 5.5% above the finite-life build once tax and maintenance are stripped out. That gap runs the way a perpetuity trap should: because the 8.21% discount rate sits well above the 4.55% combined growth rate, the multiple overstates even this genuinely long concession, not the other way round. Short remaining life makes the same error worse: six years of the same cash-flow profile yields only ~A$1,785m present value (~3.6×), so the 13.0× multiple overstates value by more than 3.5× on a six-year asset.
Using the Framework on Filings
When you open a concession owner’s annual report, locate the IFRIC 12 concession table first. Match each asset’s expiry to a row in your schedule, apply segment margin and tariff mechanics, and run DCF to that date only. Consolidated leverage (Vinci 1.4× net debt/EBITDA at group level, Getlink 3.9×) tells you balance-sheet capacity; it does not replace per-asset expiry math.
For demand-risk urban networks, start with Transurban proportional disclosure and Ferrovial 407 ETR dynamic pricing versus US managed-lane CPI caps. For inflation-linked regulated motorways, pair this DCF frame with the escalator guide rather than assuming uncapped volume × tariff everywhere.
Transport Infrastructure Sector Primer
Concession life, traffic growth and the toll escalator feed a finite-life DCF with no terminal value, landing a concession value to weigh against the EV/EBITDA shortcut.
The Excel model is the primer's concession build live across 9 sheets: a finite-life after-tax free-cash-flow DCF with zero terminal value, a WACC build block (risk-free rate, equity risk premium, relevered beta and cost of debt), a traffic-and-tariff build, a regulated-versus-demand-risk two-mode switch, a leverage screen and a multiples cross-check. Change the remaining life, any WACC input or the traffic growth and the concession value moves; the cross-check and leverage sheets update alongside it.
Frequently Asked Questions
- Why is terminal value zero in a toll road or airport concession DCF?
- Under IFRIC 12 and standard concession contracts, infrastructure reverts to the grantor at expiry without consideration. The operator holds a time-limited right, not permanent ownership. Discounting cash flows beyond the contractual end date would double-count value the contract does not confer.
- What discount rate should you use for a finite-life concession model?
- Our transport model discounts at a built nominal post-tax WACC of 8.21%, not a bond yield. Start with the 4.50% risk-free rate, add a 5.50% equity risk premium on a 0.75 asset beta relevered to 1.125 at 40% gearing, and blend with a 6.00% pre-tax cost of debt (risk-free plus a 150bp BBB spread) at 25% tax. Long-dated concession cash flows are sensitive to every piece of that build; buyers often add a project or equity-risk spread on top.
- When does EV/EBITDA misprice a concession asset?
- Headline EV/EBITDA treats cash flows as if they run forever. On a concession with only a few years left, any perpetual multiple implies far more value than a DCF to expiry with zero terminal value, because most of the multiple is paying for years the contract does not confer. On an ultra-long asset, running to the end of the century, the same multiple can understate value. Pair a multiple with the remaining life before reading it.
- How do EBITDA margins differ across transport infrastructure?
- Segment margins diverge sharply from group consolidates. FY2025 filed: Transurban proportional operating EBITDA margin 75.1%; Vinci Autoroutes 71.0%; Getlink 53.9%; Aena 59.3%; Ferrovial group ~15.1% because construction and services dilute the toll SPVs. Use segment margins when building asset-level DCFs, not group averages.