Allowed vs Earned ROE for Utilities
Allowed ROE is set prospectively; earned ROE is ex post. The US authorised cluster, FPL's 9.80%–11.80% band, and why lag pushes earned below allowed.
Educational analysis for professional use. This guide is not investment advice or a recommendation to buy or sell any security, and it is not personalised.
Allowed ROE Is Prospective; Earned ROE Is What You Actually Made
Allowed ROE is the return on equity regulators set going forward in a rate case. Earned ROE is what the utility actually earned on its regulated equity after the fact. The distinction sounds academic until you are modelling EPS in a year when the company is spending $81B on capex (Southern Company, 2026–2030 plan) but rate base has not yet caught up.
Allowed ROE answers: “What return may this opco (the regulated operating company) earn on its equity layer?” Earned ROE answers: “What did it earn given weather, O&M, financing, and regulatory timing?”
The US Authorised Cluster
Rate-case exhibits filed with state commissions in 2024–2025 show US electric utilities authorising ROEs in a tight band:
| Statistic | Value | Period |
|---|---|---|
| Median authorised electric ROE | 9.70% | Jan–Sep 2025 rate cases |
| Average authorised electric ROE | 9.66% | Jan–Sep 2025 |
| LTM median / average | 9.70% / 9.72% | To 30 Sep 2025 |
| Calendar 2024 median / average | 9.70% / 9.74% | Full year 2024 |
California’s CPUC cost-of-capital fact sheet (18 Dec 2025) states that most utility ROEs are generally close to 10%, with 2026–2028 authorised examples at 9.78%–10.03%. We screen authorised ROE at ~9%–10%; issuer orders override in comp tables.
Average authorised electric equity ratio was 49.84% in 2024 and 48.74% YTD through Sep 2025, so ROE and equity ratio are the paired levers in every cost-of-capital proceeding.
Issuer Dispersion Above the Median
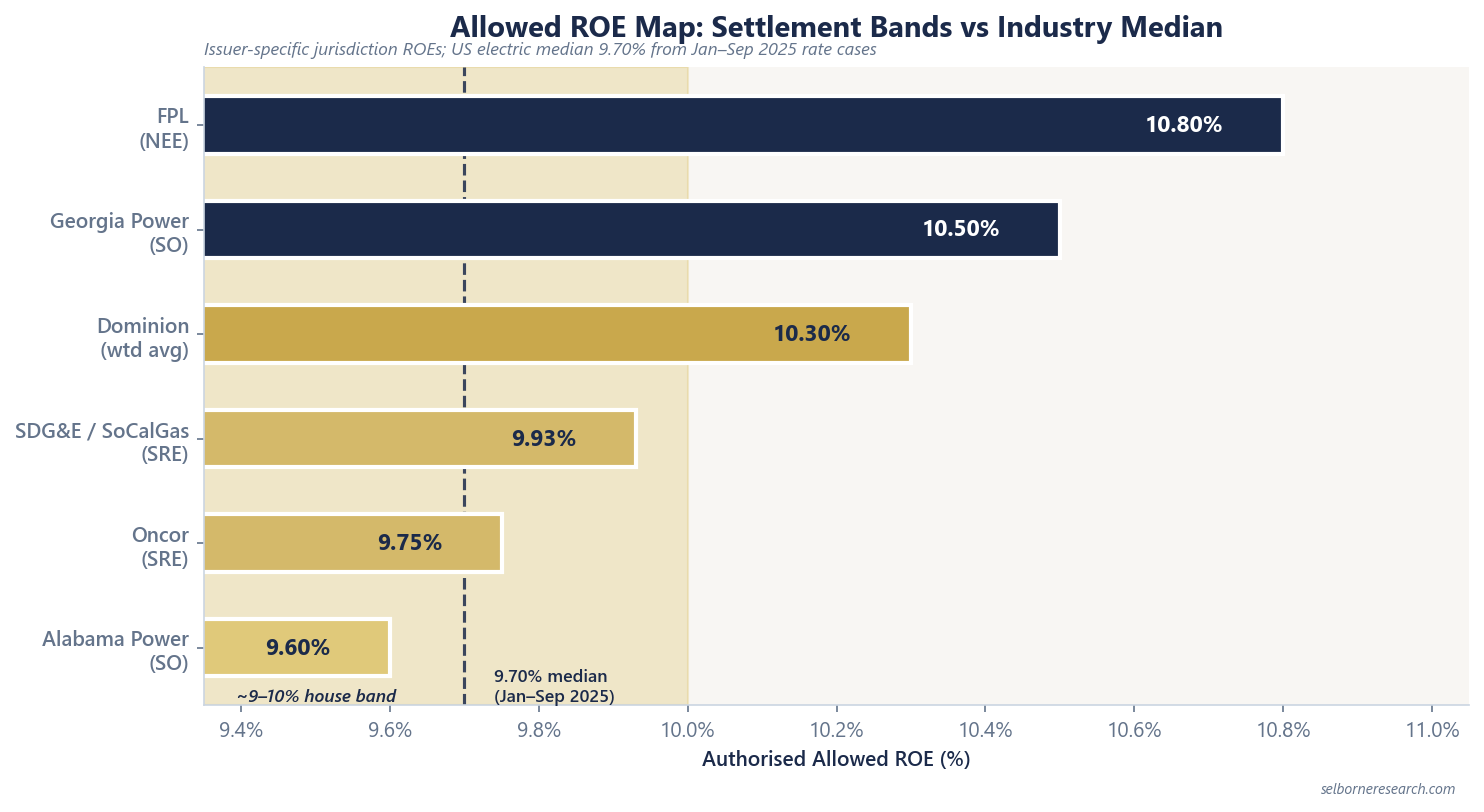
The median is not every opco. Filed FY2025 allowed ROEs among the large-cap set:
| Jurisdiction / issuer | Allowed ROE | Notes |
|---|---|---|
| NextEra FPL | 10.80% midpoint (9.80%–11.80% band) | Through Dec 2025; 10.95% from Jan 2026 |
| Southern Company Georgia Power | 10.50% | Set point at 31 Dec 2025 |
| Dominion Energy (weighted average) | 10.3% | VA base 9.80%; transmission rider (a separate surcharge mechanism) 11.40% |
| Sempra SDG&E / SoCalGas | 9.93% | CA cost-of-capital cycle |
| Sempra Oncor | 9.75% | PUCT order 17 Apr 2026 |
| Southern Company Alabama Power | 9.60% | |
| Duke Energy Florida | 10.3% | Among DEF 10.3%, DEC NC 10.1%, DEP NC 9.8% |
| AEP (by jurisdiction) | 9.25%–10.50% | Transmission companies up to 10.50% |
A name authorised at 10.50% (Georgia Power) earns roughly 80 bps more on the same equity layer than one at 9.70% median, before any earned-ROE shortfall.
FPL’s Earned-ROE Band
Florida Power & Light makes the allowed-versus-earned distinction explicit. Its authorised ROE runs on a 9.80%–11.80% band with a 10.80% midpoint through Dec 2025. If earned regulatory ROE moves outside the range, band-adjustment mechanisms can reset customer rates.
That structure ties directly to rate base: FPL reported regulatory capital employed of $73.5B (FY2025 13-month average) with a ~10% long-term plan CAGR. When new plant enters service faster than the revenue requirement updates, earned ROE can sit below the 10.80% midpoint even though the allowed band has not changed.
Why Earned ROE Lags in High-Capex Years
Four forces push earned ROE away from allowed ROE:
- Regulatory lag. New plant earns its allowed return only after it is in rate base. This guide defaults to a ~12-month lag as a working assumption; actual timing varies by jurisdiction.
- Weather and load. Revenue decoupling and fuel clauses vary by state; not all margin variance flows straight to ROE.
- O&M and staffing. Cost pressure before the next rate case shows up in earned ROE first.
- Financing costs. Interest on construction debt hits earnings before the asset is earning its allowed return.
Dominion Energy illustrates the capex side: $48.2B rate base at end-2025 with an 11.9% CAGR plan to $85.7B by 2030. Until offshore wind and transmission enter the base at authorised returns, earned ROE can print below the 10.3% weighted-average allowed ROE.
There is no free primary source for a single 2025 industry-wide earned-ROE average. Teach the gap qualitatively and pull earned metrics from each filer’s regulatory footnotes.
Mini-Example: Same Allowed ROE, Different Earned Print
Hypothetical opco: $40B rate base, 50% equity, 9.5% allowed ROE. Prospective equity return = $40B × 50% × 9.5% = $1.9B.
Suppose $4B of new plant placed in service mid-year but not yet in the tariff. Only $38B average earns the allowed return in year one:
$38B × 50% × 9.5% = $1.805B → earned ROE 9.025% on $20B equity, ~48 bps below allowed.
That gap closes as the base updates. The EPS build applies the same logic across plan years.
What Matters Most
Start with the authorised ROE from the latest commission order, not a sector average. Then ask whether the company is in a lag year between capex spend and rate-base recovery. FPL’s band mechanism and Dominion’s 11.9% rate-base CAGR plan are live cases where allowed and earned will not match in every reporting period.
Regulated Utilities Sector Primer
Earned net income less the growth in regulated equity capital drives the free-cash-flow-to-equity build, priced off rate base and allowed ROE, screened against payout, P/E and FFO-to-debt.
The Excel model is the primer's two archetype builds live across 13 sheets: free cash flow to equity, earned net income less the increase in the regulated equity book, discounted at the cost of equity, on rate base, equity ratio and allowed ROE, with the rate-base roll-forward, the FFO-to-debt headroom screen and the funding plan on their own sheets. Change the rate-base growth, the allowed ROE or the cost of equity and the value per share moves; the credit and funding sheets update alongside it.
Frequently Asked Questions
- What is allowed ROE for a utility?
- Allowed ROE is the return on equity regulators authorise prospectively in a rate case on the equity layer of capital structure. US electric utilities in 2024–2025 rate cases clustered around a 9.66%–9.70% median and average (Jan–Sep 2025). Issuer-specific allowed ROEs override any industry midpoint in comp work.
- What is earned ROE?
- Earned ROE is measured ex post from actual financial results: regulated equity earnings divided by regulated equity. It can diverge from allowed ROE because of regulatory lag on new plant, weather, O&M variances, and financing costs. There is no single published industry-wide earned-ROE average for 2025; analyse issuer by issuer.
- Why does earned ROE fall below allowed ROE during capex cycles?
- New investment earns its allowed return only after it enters rate base through a rate case or tracker mechanism. In heavy build years the company deploys equity and debt before the revenue requirement catches up, so earned ROE prints below the authorised level until plant is in service and reflected in rates.
- How does Florida Power & Light's ROE band work?
- FPL's authorised ROE runs on a 9.80%–11.80% band with a 10.80% midpoint through Dec 2025, stepping to 10.95% from Jan 2026. If earned regulatory ROE moves outside the band, adjustment mechanisms can reset customer rates. That makes FPL one of the clearest live examples of allowed versus earned ROE tracking.