Allowed ROE Benchmarks: Six US Utilities
An allowed ROE is set per jurisdiction in a rate case. Ranks six US utilities' key authorised ROE against the industry median, basis stated per row.
Educational analysis for professional use. This guide is not investment advice or a recommendation to buy or sell any security, and it is not personalised.
Allowed ROE Is Set Jurisdiction by Jurisdiction, Not Company-Wide
Allowed ROE, the return on equity a state or federal regulator authorises in a rate case, is set operating company by operating company, sometimes rider by rider, inside a specific proceeding. A group with three separately regulated subsidiaries can carry three different authorised returns at once, so comparing “Duke’s ROE” to “Dominion’s ROE” only works once you know which jurisdiction, or which blend of jurisdictions, sits behind each figure.
That is why a ranked table of six utilities needs a basis column as much as it needs a number. Rate base is the asset the return applies to; allowed ROE is the rate applied to the equity slice of it. The table below ranks each filer’s key authorised ROE, states how that figure is built (a single jurisdiction, a weighted average across several, or the range across separately filed operating companies), and gives the rate-base growth each company is compounding at the same time.
Six Filers Ranked by Key Allowed ROE
| Rank | Company | Key allowed ROE | Basis | Rate-base CAGR | As-of |
|---|---|---|---|---|---|
| 1 | NextEra Energy (FPL) | 10.80% (10.95% from Jan 2026) | Single jurisdiction (FPL) | ~10% plan | Through Dec 2025 |
| 2 | Southern Company | 9.60%–10.50% | Range by operating company (Alabama Power to Georgia Power) | 9% | Georgia Power set point, 31 Dec 2025 |
| 3 | American Electric Power | 9.25%–10.50% | Range by operating company (distribution to transmission) | ~10% | 31 Dec 2025 |
| 4 | Dominion Energy | 10.30% | Weighted average (Virginia base 9.80%, transmission rider 11.40%) | 11.9% | FY2025 |
| 5 | Duke Energy | 9.80%–10.30% | Range by operating company (Progress to Florida) | ~9.6% | FY2025 10-K regulatory summary |
| 6 | Sempra | 9.75%–10.10% | Range by operating company (Oncor to SDG&E FERC) | 11% | Oncor order 17 Apr 2026; SDG&E FY2025 |
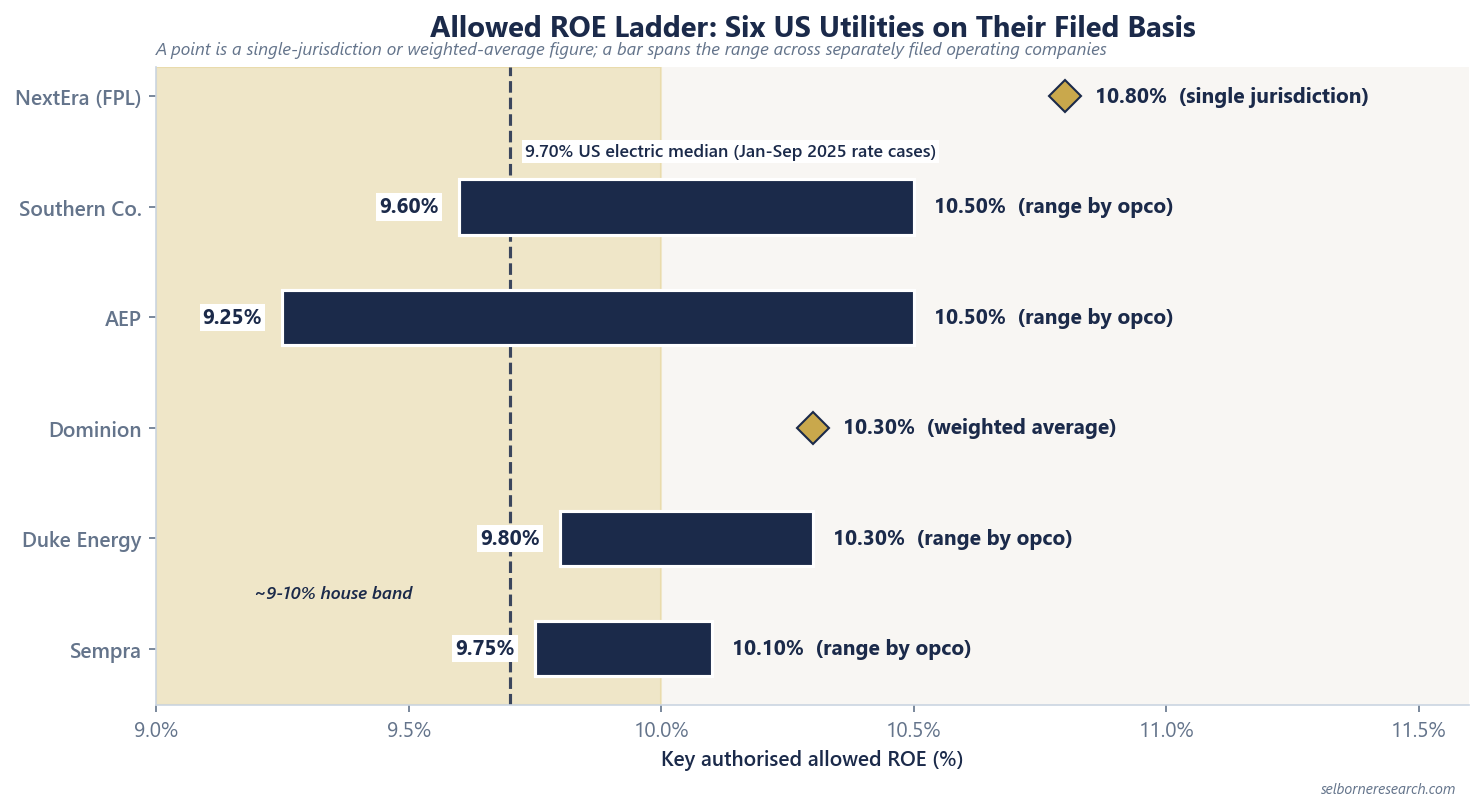
The chart draws the same six rows on their filed basis: a point where a company reports a single-jurisdiction or weighted-average figure, a bar where its authorised returns span separately filed operating companies, against the 9.70% median from US electric rate cases decided between January and September 2025.
Two Pairs Tied at the Same Headline Number, for Different Reasons
Southern Company and American Electric Power both top out at 10.50%, and the two figures rest on different kinds of evidence. Southern’s 10.50% is a single filed order for Georgia Power, its largest operating company, set at 31 December 2025. AEP’s 10.50% is the ceiling of a range spanning several jurisdictions, authorised only for its transmission companies; AEP’s distribution utilities run as low as 9.25%. A reader who treats the two 10.50% figures as directly comparable is really comparing one company’s largest single order against another company’s best case.
Dominion Energy and Duke Energy show the same pattern at 10.30%. Dominion’s figure is a company-calculated weighted average blending a 9.80% Virginia electric base with an 11.40% transmission rider. Duke’s is the highest of three separately filed orders, Duke Energy Florida at 10.3% against Duke Energy Carolinas at 10.1% and Duke Energy Progress at 9.8%. One is a blend across the whole company; the other is a single operating company’s top result. Both land on the same headline figure without either company’s overall regulatory position being identical.
A High Allowed ROE Is Not a High Earned ROE
None of the figures above say what a utility actually earned. Allowed ROE is the rate a regulator authorises prospectively; earned ROE is what the company reports after weather, operating costs, financing and the timing of new plant entering rate base all take their toll. Allowed versus earned ROE sets out why the two diverge and by how much in a heavy capex year. A company sitting near the top of the table above, such as NextEra’s FPL at 10.80%, is authorised to earn more than one lower down it. Whether it actually does depends on everything that happens between the rate case and the results.
What Moves an Allowed ROE
Three forces reset the number, and none of them is the company’s own performance in the period being measured.
Rate-case settlements are the direct mechanism. Every allowed ROE in the table above came out of a specific state or federal proceeding, negotiated or litigated, and it holds until the next case revisits it. That is why the same company can carry different authorised returns across operating companies: each jurisdiction runs its own case on its own timetable.
Regulators anchor the cost of equity to the risk-free rate plus a utility equity risk premium, using the 10-year Treasury yield as their reference point, so a sustained move in the 10-year tends to show up in the next round of rate cases. An already-authorised ROE stays fixed for the life of its case regardless of what the Treasury does in between.
The equity layer of the capital structure is the other lever, and it is usually traded off against ROE in the same proceeding. US authorised equity ratios have averaged around 49% across 2024 and 2025. A commission weighing a rate-case settlement can hold the overall revenue requirement roughly steady while moving ROE and equity ratio in opposite directions, so the two numbers have to be read together.
What Matters Most
Pull the filed order for the specific operating company you are modelling, rather than a company average lifted from a comp table. A single 10.50% or 10.30% headline can hide a range across jurisdictions or a blended calculation, and the rate base it applies to, and the FFO/debt headroom the growth plan needs, matter as much as the rate itself.
Regulated Utilities Sector Primer
Rate base, allowed return and the payout are the inputs. This primer takes them through a free-cash-flow-to-equity build, earned net income less the increase in the regulated equity book, to a value per share you can screen against P/E and credit.
The Excel model is the primer's two archetype builds live across 13 sheets: free cash flow to equity, earned net income less the increase in the regulated equity book, discounted at the cost of equity, on rate base, equity ratio and allowed ROE, with the rate-base roll-forward, the FFO-to-debt headroom screen and the funding plan on their own sheets. Change the rate-base growth, the allowed ROE or the cost of equity and the value per share moves; the credit and funding sheets update alongside it.
Frequently Asked Questions
- What is an allowed ROE?
- Allowed ROE is the return on equity a regulator authorises in a rate case, applied to the equity layer of a utility's capital structure. It is set prospectively, operating company by operating company, and holds until the next rate case revisits it. It differs from earned ROE, which is measured after the fact from actual results.
- Which US utility has the highest allowed ROE?
- Among the six large-cap utilities compared here, NextEra's Florida Power and Light carries the highest single-jurisdiction figure at 10.80%, stepping to 10.95% from January 2026. That is an authorised rate for one operating company, not a company average, and a higher allowed ROE does not by itself mean a higher earned ROE or a better investment.
- Why do Southern Company and American Electric Power both show a 10.50% allowed ROE?
- The two figures measure different things. Southern's 10.50% is a single filed order for Georgia Power, its largest operating company. AEP's 10.50% is the top of a range across several jurisdictions, authorised only for its transmission companies, with its distribution utilities as low as 9.25%. The same headline number rests on different regulatory footprints.
- What causes a utility's allowed ROE to change?
- Three things move it: the outcome of the next rate-case settlement or litigated order, sustained movement in the 10-year Treasury yield that regulators use as the cost-of-equity anchor, and the equity ratio negotiated in the same proceeding, which commissions often trade off against ROE to hold the overall revenue requirement steady.