FFO/Debt: the Utility Funding Gate
FFO/debt scorecards for utility credit, a 14%-16% investment-grade screen, and when tight coverage forces equity issuance on high rate-base growth plans.
Educational analysis for professional use. This guide is not investment advice or a recommendation to buy or sell any security, and it is not personalised.
FFO/Debt Is the Gate Between Growth and Dilution
Regulated utilities fund record capex plans with a mix of retained earnings, debt, and periodic equity. Rating agencies do not reward rate-base growth if leverage coverage breaks. FFO/debt (or Moody’s CFO pre-working-capital to debt) is the metric that tells you whether the plan fits inside investment-grade headroom or needs a dilutive equity raise.
This is not a single published cutoff. It is a scorecard plus a screening threshold anchored on peer actuals.
Agency Frameworks
| Source | Metric | What it says |
|---|---|---|
| Moody’s Standard Grid (Baa) | CFO pre-WC / debt | 13%–22% band; 15% weight in scorecard |
| S&P utility matrix (Nov 2007) | FFO/debt indicative ranges | Modest risk 40%–60%; intermediate 25%–45% (older matrix, not a live cutoff) |
| Con Edison A- (issuer illustration) | FFO/debt stable band | 16%–18%; downgrade pressure below 16% |
S&P does not publish one universal FFO/debt floor for all regulated utilities. Moody’s uses a range, not a bright line. We screen regulated holdcos (parent holding companies) with strong regulatory frameworks at roughly ~14%–16%+ FFO/debt for investment-grade headroom, between Moody’s Baa floor (13%) and Con Ed’s A- stable band (16%–18%).
Sempra’s credit materials cite Moody’s 14% and S&P 13% thresholds with a 50–150 bps cushion goal post-SI Partners sale. Issuer decks quote agency marks; analysts still run their own FFO/debt from filed cash flow and debt.
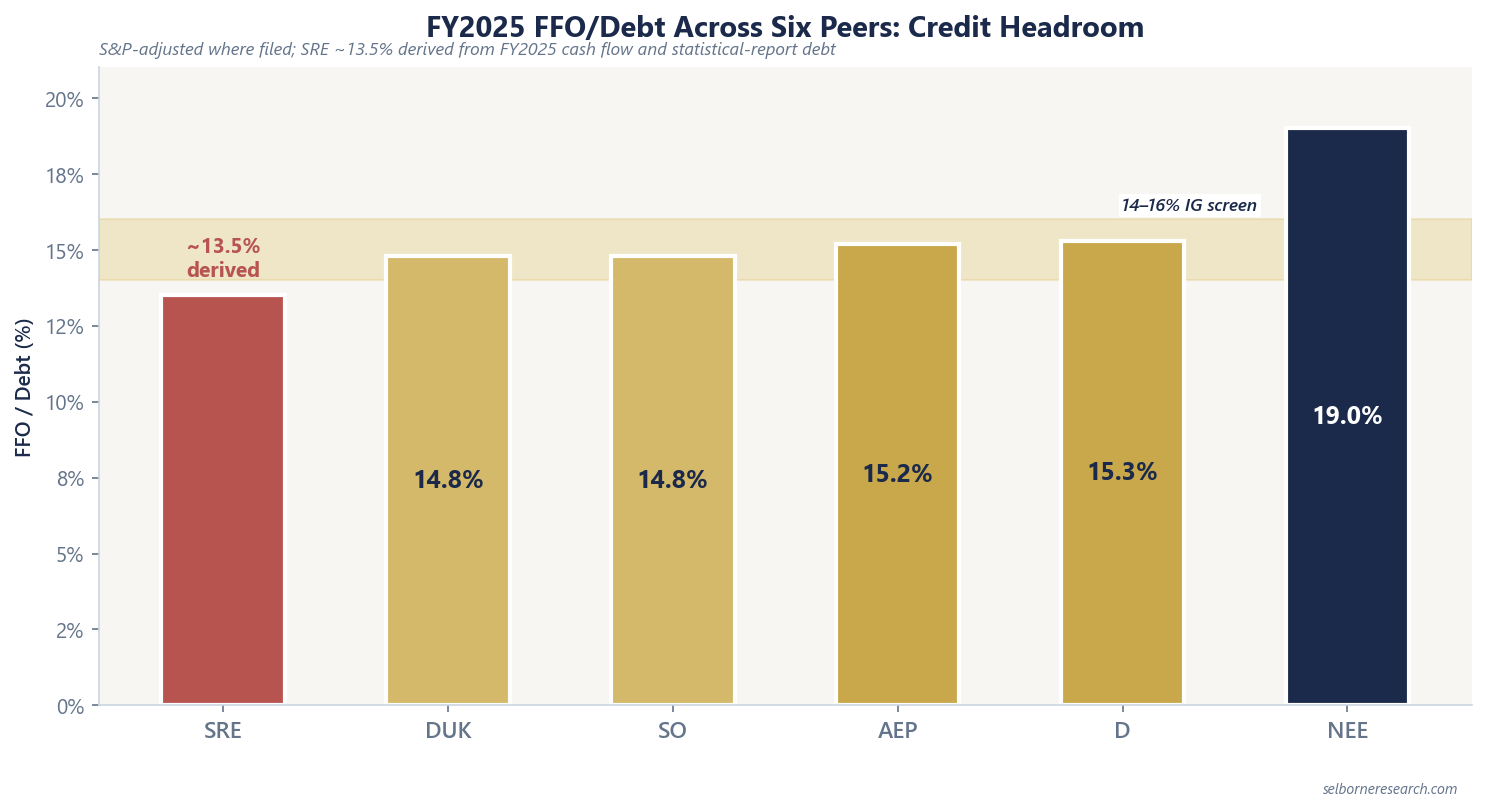
FY2025 Peer Comparison
FY2025 filed coverage among the large-cap set:
| Company | FFO/debt | Notes |
|---|---|---|
| NextEra Energy | 19.0% | S&P-adjusted; 2026 target >18% |
| Dominion Energy | 15.3% | 14.9% CFO pre-WC (Moody’s) |
| American Electric Power | 15.2% (S&P) / 13.9% (Moody’s) | Dual agency read |
| Duke Energy | 14.8% | 15% long-term target |
| Southern Company | 14.8% | |
| Sempra | ~13.5% | Derived: FFO $5,820M ÷ debt $43,176M |
The spread from ~13.5% to 19.0% is wide enough to separate names that can self-fund aggressive rate-base growth from names that may need external equity.
The Equity-Issuance Flag
When stated rate-base CAGR exceeds 9% and FFO/debt sits within ~50 bps of the ~14% floor, assume periodic equity issuance in the plan.
Live FY2025 cases:
| Company | RB CAGR | FFO/debt | Why it flags |
|---|---|---|---|
| Sempra | 11% to $97B by 2030 | ~13.5% | Below Moody’s 14% threshold cited in deck |
| American Electric Power | ~10% to ~$128B | 13.9% (Moody’s) | Within 50 bps of 14% |
| Dominion Energy | 11.9% | 15.3% | Above floor today; ~78% payout limits retention |
| Duke Energy | ~9.6% | 14.8% vs 15% target | Thin headroom to stated goal |
High growth plus tight coverage compresses the P/E premium the market might otherwise pay for an 11% rate-base plan.
Mini-Example: Headroom on a $40B Plan
Hypothetical pure-regulated opco (a regulated operating company on its own, with no holdco layer): $40B rate base, 9% RB CAGR, 16% FFO/debt (inside the IG screening band), 60% payout.
Year-zero FFO ≈ 16% × debt. If debt is $20B (50% of $40B rate base as a rough capital-structure proxy), FFO ≈ $3.2B.
9% rate-base growth adds roughly $3.6B gross plant per year before equity/debt mix. Retaining 40% of $1.9B equity earnings ($760M) plus incremental debt capacity at constant 16% FFO/debt covers part of the plan; the remainder may require equity if coverage cannot fall toward 14%.
Drop FFO/debt to 14.2% (−180 bps) on the same 11% RB CAGR plan and the unfunded slice widens. That is the Sempra/AEP situation with double-digit rate-base targets.
What FFO/Debt Is Not
FFO/debt is not a replacement for allowed ROE or rate-base analysis. A utility can show 19.0% coverage (NextEra) while consolidated EPS blends FPL with merchant renewables. Read holdco FFO/debt alongside jurisdictional rate-base and allowed-ROE inputs from the filer’s regulatory summary.
Payout policy matters: Dominion’s ~78% payout leaves less retained cash than Sempra’s 55.0% on adjusted EPS, regardless of where each name’s FFO/debt sits on yesterday’s balance sheet.
What Matters Most
Run FFO/debt (and Moody’s CFO pre-WC where disclosed) before you capitalise a growth premium. 14.8%–15.3% names have room to execute; ~13.5%–13.9% names on 10%–11% rate-base plans are where dilution risk belongs in the model.
Regulated Utilities Sector Primer
Earned net income less the growth in regulated equity capital drives the free-cash-flow-to-equity build, priced off rate base and allowed ROE, screened against payout, P/E and FFO-to-debt.
The Excel model is the primer's two archetype builds live across 13 sheets: free cash flow to equity, earned net income less the increase in the regulated equity book, discounted at the cost of equity, on rate base, equity ratio and allowed ROE, with the rate-base roll-forward, the FFO-to-debt headroom screen and the funding plan on their own sheets. Change the rate-base growth, the allowed ROE or the cost of equity and the value per share moves; the credit and funding sheets update alongside it.
Frequently Asked Questions
- What FFO/debt ratio do utilities need for investment-grade credit?
- Neither Moody's nor S&P publishes one fixed FFO/debt cutoff for regulated utilities; both use scorecards. Moody's Baa Standard Grid assigns 15% weight to CFO pre-working-capital to debt in a 13%–22% band. A screening threshold of roughly 14%–16%+ FFO/debt supports IG at a regulated holdco (the parent holding company) when business risk is strong.
- What is a good FFO to debt for a utility?
- FY2025 large-cap actuals span 13.5% to 19.0%: Sempra ~13.5% (derived), Duke and Southern 14.8%, Dominion 15.3%, AEP 15.2% (S&P) / 13.9% (Moody's), NextEra 19.0% (S&P-adjusted). Names at or below ~14% face equity-issuance pressure when rate-base CAGR exceeds 9%.
- When do utilities need to issue equity?
- The screening rule used here flags periodic equity issuance when stated rate-base CAGR exceeds 9% and FFO/debt sits within ~50 bps of the ~14% IG floor. Live cases: Sempra ~13.5% with an 11% rate-base plan; AEP Moody's 13.9% versus a 14% threshold; Duke 14.8% actual against a 15% long-term target.
- How does FFO/debt differ from Moody's CFO pre-WC to debt?
- S&P and issuers often cite FFO/debt; Moody's scorecards use CFO pre-working-capital to debt with a 13%–22% Baa band on the Standard Grid. Dominion reports 15.3% FFO/debt and 14.9% CFO pre-WC (Moody's) for FY2025. Treat them as related coverage metrics, not identical inputs.