Utility FFO/Debt Benchmarks: Six US Peers
FFO/debt is the rating agencies' cash coverage test. Ranks six US utilities' FY2025 coverage against a stated screen, basis labelled per row.
Educational analysis for professional use. This guide is not investment advice or a recommendation to buy or sell any security, and it is not personalised.
FFO/Debt Ranks Cash Coverage, and the Basis Behind Each Number Moves the Rank
FFO/debt, funds from operations divided by total debt, is the rating agencies’ test of whether a utility’s cash generation can carry its debt load while it funds a growing rate base. It is a credit measure, not a valuation one: a high ratio says a company can fund its capex plan with less strain on the balance sheet, nothing about whether its shares are worth buying.
Six large-cap US utilities filed FY2025 FFO/debt spanning roughly 13.5% to 19.0%, a wide enough range to separate names with headroom from names close to the line. The full agency scorecards, Moody’s Baa grid and S&P’s utility matrix, sit on the funding-gate guide; this page ranks the six filers on their FY2025 figures and states each one’s reporting basis, because two of the numbers below are not built the same way.
Six Filers Ranked by FY2025 FFO/Debt
| Rank | Company | FFO/debt | Basis | As-of |
|---|---|---|---|---|
| 1 | NextEra Energy | 19.0% | S&P-adjusted | FY2025 |
| 2 | Dominion Energy | 15.3% | As filed | FY2025 |
| 3 | American Electric Power | 15.2% / 13.9% | S&P-adjusted / Moody’s CFO pre-WC | 31 Dec 2025 |
| 4 | Duke Energy | 14.8% | As filed | FY2025 |
| 5 | Southern Company | 14.8% | As filed | FY2025 |
| 6 | Sempra | ~13.5% | Derived (FFO ÷ debt) | FY2025 |
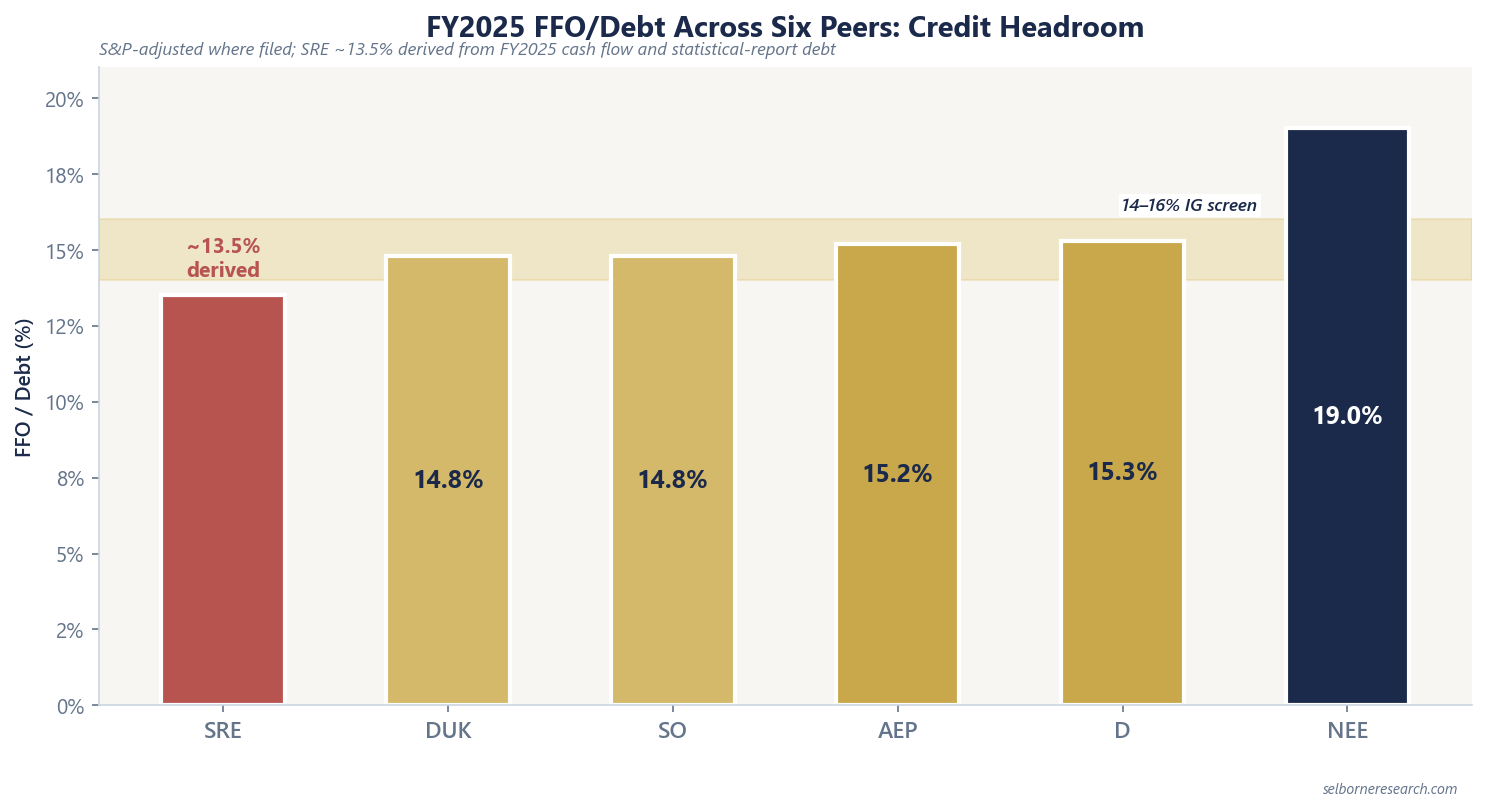
Sempra’s ~13.5% is the one figure on the table that is not a headline number a company itself quotes. It is derived from FY2025 cash flow (FFO of $5,820 million against debt of $43,176 million reported in the statistical report), which puts it below every other name in the set and inside the range this site’s screen treats as tight.
This Site’s Screen Sits Inside a Wide Range Neither Agency Publishes
Neither Moody’s nor S&P states a single FFO/debt cutoff for investment grade at a regulated utility. Moody’s Baa grid runs a 13%-22% band on CFO pre-working-capital to debt; Con Edison, rated A-, cites a stable band of 16%-18% for its own credit, with downgrade pressure below 16%; an older S&P matrix used ranges far above both (40%-60% for its lowest-risk category), built on a different definition of the ratio and dated to 2007. None of the three is a working answer on its own, and none of the six companies in the table above is Con Edison.
This site’s own screen, roughly 14%-16%, sits inside that spread as a working screen we state rather than source, calibrated to where the peer group in the table above actually clusters. Four of the six names, Duke, Southern, AEP on its S&P basis, and Dominion, sit inside it. NextEra sits comfortably above it. Sempra and AEP on its Moody’s basis sit at or below the floor.
The Same Company Can Clear the Screen or Miss It Depending on Who Is Asked
American Electric Power is the clearest case of basis changing the read. Its S&P-adjusted FFO/debt of 15.2% sits inside the working screen. Its Moody’s CFO-pre-working-capital figure of 13.9% sits just below the 14% floor. Both numbers describe the same company in the same fiscal year; the gap is entirely in how each agency defines the cash-flow numerator, not in AEP’s underlying performance. Dominion shows a smaller version of the same pattern: 15.3% FFO-to-debt against 14.9% on Moody’s CFO pre-working-capital measure.
The practical lesson is not to average the two AEP figures or pick whichever one is more flattering. State which agency’s basis a number comes from before ranking it against a peer, the same discipline this table applies throughout.
A Tight Ratio Matters Most Alongside a Fast-Growing Rate Base
FFO/debt on its own does not say whether a company needs to raise equity. What matters is coverage relative to how fast the rate base it is funding is growing. Sempra’s ~13.5% sits against an 11% stated rate-base CAGR; AEP’s 13.9% Moody’s read sits against a roughly 10% plan. Both combinations, tight coverage paired with a double-digit growth plan, are the setup this site treats as a flag for likely equity issuance, covered in full on the funding-gate guide. A single FFO/debt number without its growth plan alongside it is only half the picture.
Regulated Utilities Sector Primer
Rate base, allowed return and the payout are the inputs. This primer takes them through a free-cash-flow-to-equity build, earned net income less the increase in the regulated equity book, to a value per share you can screen against P/E and credit.
The Excel model is the primer's two archetype builds live across 13 sheets: free cash flow to equity, earned net income less the increase in the regulated equity book, discounted at the cost of equity, on rate base, equity ratio and allowed ROE, with the rate-base roll-forward, the FFO-to-debt headroom screen and the funding plan on their own sheets. Change the rate-base growth, the allowed ROE or the cost of equity and the value per share moves; the credit and funding sheets update alongside it.
Frequently Asked Questions
- What is a good FFO/debt ratio for a regulated utility?
- Neither Moody's nor S&P publishes a single fixed cutoff; both use scorecards rather than a bright line. This site works to a screen of roughly 14%-16% funds from operations to debt at a regulated holding company (holdco) with a strong regulatory framework, a level it states as a working screen rather than sources from either agency.
- Which large US utility had the highest FFO/debt in FY2025?
- NextEra Energy led the six-name set at 19.0% on an S&P-adjusted basis. That reflects strong cash coverage relative to debt, not a valuation call: FFO/debt says nothing about where a share trades.
- Why does American Electric Power show two different FFO/debt figures?
- AEP's cash flow is read on two agency bases at once: 15.2% on an S&P-adjusted basis and 13.9% under Moody's CFO-pre-working-capital measure. The gap comes from how each agency defines the numerator, so a comparison against AEP has to state which basis it is using.
- What happens when a utility's FFO/debt sits below the investment-grade screen?
- A ratio close to or below the working 14% floor, paired with a fast-growing rate base, is the setup this site flags for likely equity issuance: the capex plan needs funding from somewhere, and tight debt coverage narrows how much of it debt alone can carry.