Book Value per Share: the mREIT Scoreboard
Learn how book value per share, economic return and price-to-book guide agency mortgage REIT analysis and valuation.
Educational analysis for professional use. This guide is not investment advice or a recommendation to buy or sell any security, and it is not personalised.
The Dividend Is Only Half the Return
A mortgage REIT yielding 13% has not paid you 13%. What you earned is the dividend plus the change in book value per share, and on a bond portfolio bought largely with borrowed money that second number is big enough to swallow the first. If book falls by more than the year’s dividends, the payout was your own capital coming back.
That is why the sector is judged on book value per share rather than on earnings. Equity REITs own buildings, which are carried at cost less depreciation and only revalued when they are sold, so their share prices are argued out against cap rates and net asset value. An agency mortgage REIT owns mortgage bonds with an observable market price, so its balance sheet is remarked every quarter and the answer lands in one figure that Annaly and AGNC both publish.
What Book Value per Share Actually Measures
Book value per share is common equity divided by common shares outstanding. Common equity is total shareholders’ equity less the liquidation preference of the preferred stock, which ranks ahead of you and which these companies issue in size. Take total equity straight off the balance sheet and divide by the share count and you will overstate the book.
Because nearly everything on both sides of the book is carried at fair value, that figure is close to a live estimate of what the portfolio would fetch. Which is also why it moves so much.
Two things move it:
- The assets. Agency mortgage-backed securities (MBS) are bonds. When yields on them rise, their price falls and equity falls with it. The damaging version is not a general rise in interest rates but a widening in the spread: the extra yield mortgage bonds pay over Treasuries. Spread widening marks the assets down while Treasury yields sit still.
- The hedges. Interest rate swaps and short TBA positions are marked to market too, in the opposite direction, and are meant to cancel most of the asset move.
The gap between those two is where book value is actually won or lost. Hedges are usually tied to Treasury or swap rates, so when the mortgage-to-Treasury spread widens the assets fall and the hedge does not rise to meet them. The asset also changes shape mid-quarter: faster prepayments shorten the MBS, which leaves a hedge sized for last quarter’s portfolio too large for this one. A quarter can therefore show a healthy net interest spread and a lower book at the same time, and leverage multiplies the mismatch into equity.
Book, Tangible Book, and Which One the Ratio Uses
Filers do not all headline the same book definition, so a price-to-book comparison has to use the figure each company actually reports.
| Company | Book metric (31 Dec 2025) | Start FY2025 | End FY2025 | FY2025 change |
|---|---|---|---|---|
| Annaly (NLY) | Book value per common share | $19.15 | $20.21 | +5.5% |
| AGNC | Tangible net BVPS | $8.41 | $8.88 | +5.6% |
| Rithm (RITM) | Book value per common share | n/a | $12.66 | (point-in-time) |
| Starwood (STWD) | GAAP book value per share | n/a | $18.34 | (point-in-time) |
| Blackstone Mortgage (BXMT) | Book value per share | n/a | $20.75 | (point-in-time) |
AGNC’s tangible net figure excludes goodwill. NLY reports book value per common share on a GAAP basis that the market treats as the agency standard. Commercial real estate lenders still use price-to-book, but their books move on loan marks and expected-loss reserves rather than on MBS prices, so the same ratio is answering a different question.
Economic Return: Book Change Plus Dividends
Economic return is the sector’s own name for the total return calculation above, measured on book rather than on the share price.
Formula: Economic return = (ΔBVPS + dividends per share) ÷ beginning BVPS
| Company | Beginning BVPS | Ending BVPS | Dividends FY2025 | Economic return |
|---|---|---|---|---|
| NLY | $19.15 | $20.21 | $2.80 ($0.70/qtr) | 20.2% |
| AGNC | $8.41 (TNBVPS) | $8.88 | $1.44 | 22.7% |
Both grew book roughly 5.5–5.6% in FY2025 and paid a double-digit dividend on top. That combination is what a good year looks like, and it is why the market was paying at or above book: it was pricing continuation, not erosion.
Run the same sum through a bad year and the point of the metric becomes clearer. Take a share bought at $20 of book paying $2.60 of dividends, in a year when rates rise sharply and hedges cover only part of it, leaving book at $16.50. The dividend yield on book was 13%. The economic return was ($16.50 − $20.00 + $2.60) ÷ $20.00 = −4.5%. The 2022 rate shock did this to the agency sector: the large names posted deeply negative economic returns while continuing to pay headline yields in the teens. A dividend that arrives while book is falling faster is not income.
Price-to-Book Is a Forecast, Not a Discount Rack
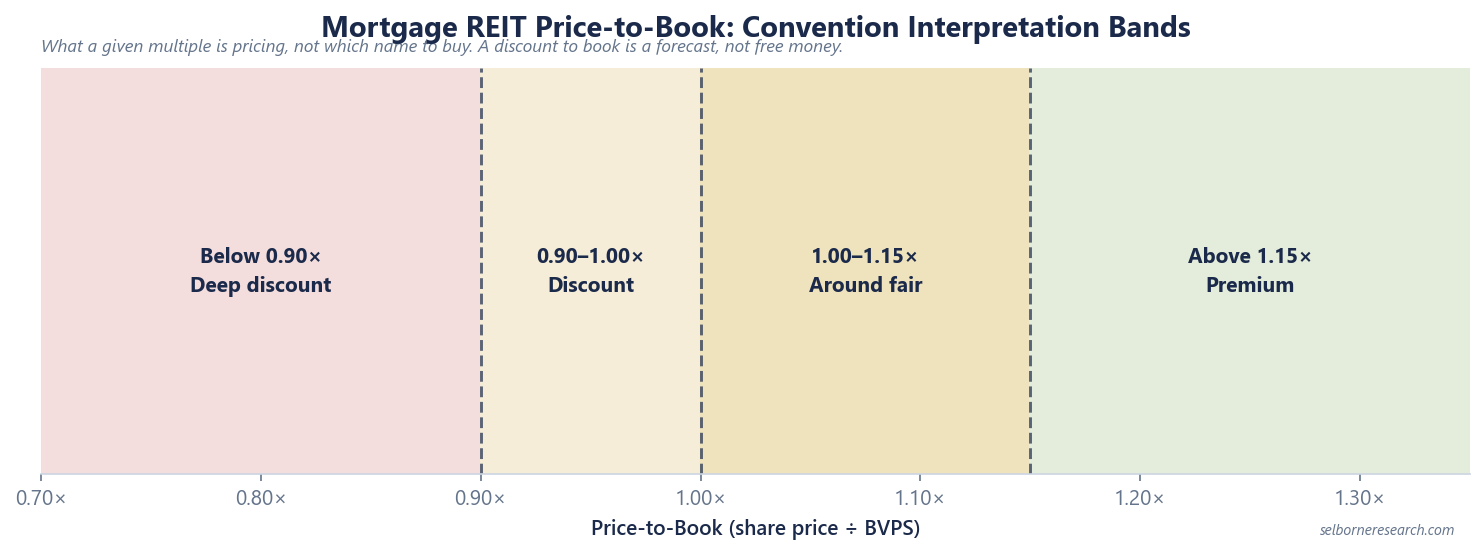
Price-to-book is the share price divided by book value per share. Rather than rank live names on it, hold the ratio against a set of convention interpretation bands, which say what a given multiple is pricing rather than which stock to buy:
| P/B band | Reading |
|---|---|
| <0.90× | Deep discount: market prices material book decline |
| 0.90–1.00× | Discount: cautious on the book path |
| 1.00–1.15× | Around fair for quality agency books |
| >1.15× | Premium: book growth, scale, or franchise value priced in |
These are working conventions, not a trading signal. The instinct on seeing a stock at a deep discount to book is that you are buying a dollar for well under a dollar. You are not, and this is the single most expensive misreading in the sector. A discount to book says the market disagrees with one of three things: that the book will still be there next year, that the marks are honest, or that the shareholder gets to keep the returns the book generates. That third one is the quiet drain at externally managed REITs, where a management fee charged on equity is a permanent claim ahead of you and the market capitalises it as a discount. Illiquid or model-priced assets attract the second doubt, which is why a loan book trades further below par than a portfolio of quoted agency MBS.
The discount does have one honest use. A REIT that repurchases its own stock below book raises the book value of every share that remains. Start with 100 shares and $2,000 of equity, so $20.00 a share. Buy back 10 shares at $17.00, spending $170. Equity falls to $1,830 across 90 shares, or $20.33 a share, a gain of 1.7% for holders who did nothing. Above book the arithmetic runs the other way and buybacks quietly destroy book, which is worth checking before applauding one.
Worked Mini-Example: NLY Economic Return Check
Rebuild Annaly’s disclosed 20.2% economic return from filed book value and dividends:
- Beginning BVPS (31 Dec 2024): $19.15
- Ending BVPS (31 Dec 2025): $20.21
- BVPS change: $20.21 − $19.15 = $1.06
- FY2025 dividends: $0.70 × 4 = $2.80
- Total return on book: $1.06 + $2.80 = $3.86
- Economic return: $3.86 ÷ $19.15 = 20.2%
Note what carried the result. The dividend supplied $2.80 of the $3.86; the book contributed the other $1.06 by not falling. Repeating the year needs spread stability and prepayment discipline at the 5.6× economic leverage NLY disclosed for end-FY2025.
CRE and Hybrid Books: Same Frame, Different Drivers
Move off agency MBS and price-to-book keeps its shape but changes its content. Starwood’s $18.34 GAAP book and Blackstone Mortgage’s $20.75 are loan books, so they fall when borrowers stop paying and management writes the loan down, not when a bond price moves. Both cases show why the ratio needs a second number beside it. Starwood’s FY2025 distributable earnings of $1.69 a share covered only 0.88× its $1.92 dividend. Blackstone Mortgage reported distributable EPS of $(1.43) after charge-offs against $1.88 of dividends. Each was paying out of something other than what it earned, which is a claim on next year’s book.
Rithm is a third case again. Most of its value sits in mortgage servicing rights, the contractual right to collect payments on loans someone else owns, and those are priced by a model rather than quoted on a screen. They also move the opposite way to an agency book: rising rates slow refinancing, so the servicing lasts longer and gains value. See agency vs hybrid mortgage REITs for why that book cannot be ranked against NLY or AGNC on price-to-book alone.
An mREIT earns a premium to book only by out-earning its cost of equity. The primer tests each premium against returns earned.
The Excel model is the primer's two worked valuations live across 13 sheets: change the spread, leverage or cost of equity and the valuation moves.
Frequently Asked Questions
- What is book value per share for a mortgage REIT?
- BVPS is common equity divided by common shares outstanding at period end. Common equity is total shareholders' equity less the liquidation preference of the preferred stock, which ranks ahead of the common and which these companies use heavily. Agency filers publish BVPS every quarter; AGNC uses tangible net BVPS, which excludes goodwill. Because the assets and hedges are carried at fair value, rate and spread moves flow straight into the figure.
- Is a high mortgage REIT dividend yield the return?
- No. The return is the dividend plus the change in book value per share. A 13% yield paid in a year when book value falls 15% is a loss, and the cash you received was partly your own capital coming back. Always read the dividend against the book value path for the same period.
- How do you calculate economic return for an agency mREIT?
- Economic return = (ending BVPS − beginning BVPS + dividends per share) ÷ beginning BVPS. Annaly reported 20.2% for FY2025: ($20.21 − $19.15 + $2.80) ÷ $19.15. AGNC reported 22.7% on tangible common equity. It is total return measured on book rather than on the share price, and it can be deeply negative in a bad rate year.
- What is a good price-to-book for mortgage REITs?
- There is no single good number; price-to-book is a forecast, not a discount rack. Illustrative convention bands read it this way: below 0.90× prices material book erosion; 0.90–1.00× is cautious on the book path; 1.00–1.15× is around fair for quality agency books; above 1.15× embeds book growth or franchise value. A discount is not free money. It usually means the market expects the book to fall, doubts the marks, or is charging for an external manager's fees.
- Why does AGNC use tangible net book value instead of GAAP book?
- AGNC strips goodwill and certain intangible items to report tangible net BVPS ($8.88 at 31 December 2025). Its price-to-book and economic return are computed on that basis, so comparing AGNC to NLY means setting AGNC's tangible figure against NLY's book value per common share ($20.21), not against a GAAP book number taken from a different filer.