mREIT Leverage: Economic vs At-Risk Definitions
Learn the difference between economic and at-risk mortgage REIT leverage, including TBA exposure, hedging and peer comparison.
Educational analysis for professional use. This guide is not investment advice or a recommendation to buy or sell any security, and it is not personalised.
NLY at 5.6× and AGNC at 7.2× Are Not the Same Ratio
Agency mortgage REITs run levered books, and the multiple on the earnings release is not comparable across filers unless you read the footnote. Annaly (NLY) reports 5.6× economic leverage. AGNC Investment (AGNC) reports 7.2× at-risk leverage. The numerators genuinely differ, and Annaly’s picks up Treasury financing that AGNC’s leaves out. The denominators barely do. So most of the 1.6 turns is real: AGNC runs a harder book against a pure agency portfolio, while Annaly also holds residential credit and servicing rights that cannot be levered the same way.
There is a second error underneath it. The ratio is not the risk. What destroys book value at these companies is the funding mechanism behind the ratio, and a lower number tells you nothing about that on its own.
Two Definitions, Side by Side
| Item | NLY economic leverage | AGNC at-risk leverage |
|---|---|---|
| End-FY2025 | 5.6× | 7.2× |
| FY2025 range | 5.6–5.8× (5.7 Mar, 5.8 Jun, 5.7 Sep, 5.6 Dec) | 7.2–7.6× (7.5 Mar, 7.6 Jun, 7.6 Sep, 7.2 Dec) |
| Numerator | Recourse debt + TBA cost + net forward purchases | Repo + consolidated vehicle debt + net TBA at cost |
| Denominator | Total equity, including preferred | Total stockholders’ equity less goodwill |
The denominators are nearly the same, so they are not where the gap comes from. Annaly’s numerator is the broader of the two, because it picks up Treasury financing that AGNC’s measure leaves out, which if anything understates the difference. The gap is mostly what each company owns.
NLY runs roughly 1.6 turns lower than AGNC on these company lines (7.2 − 5.6), or about 22% less levered (5.6 ÷ 7.2). Take that at face value: rebuilding both on one basis would not reverse it.
Repo, Haircuts and the Margin Call
Repo, short for a repurchase agreement, is how the whole thing is funded. The REIT sells an MBS to a lender today and agrees to buy it back in 30 to 90 days at a fixed price. It is a secured loan with the bond as collateral, and the difference between the two prices is the interest.
Three features of that arrangement drive everything else on this page.
The lender advances less than the bond is worth. The shortfall is the haircut, a few per cent on agency collateral. That shortfall is the equity the REIT has to fund itself, which is why a book of high-quality, low-haircut collateral can be levered so many times over.
The loan has to be rolled. A book funded on 30-day repo refinances itself roughly twelve times a year, at whatever rate lenders charge on the day. Lenders can also decline to renew.
The collateral is marked daily. This is the part that matters. When MBS prices fall, the collateral no longer covers the loan, and the lender issues a margin call for cash or additional bonds, usually settling the same day. The REIT meets it from its liquidity buffer. If the move is large or the buffer is thin, it meets it by selling MBS into the market that has just fallen.
That last step is the loop. Selling turns a mark into a realised loss the book can never recover, and because every levered holder is being called on the same day, the selling itself pushes prices lower and sets off the next round of calls. Leverage sets how far a given price move travels into equity, but the forced sale is what makes the damage permanent. In March 2020 several mortgage REITs could not meet agency repo margin calls and liquidated most of their portfolios; some never rebuilt them.
What Enters the Numerator
| Component | Role in the book | Effect on leverage and spread |
|---|---|---|
| Agency MBS | Interest-earning assets | Duration and spread driver |
| Repo | Short-term secured funding | Liability cost; the main leverage line |
| TBA positions | Forward contracts on generic MBS, used to hedge or to hold exposure | Enter both companies’ numerators |
| Interest rate swaps | Rate hedge | Cut rate-driven book moves; cost spread |
| Net forward purchases | Trades agreed but not yet settled | Part of NLY economic leverage |
TBA stands for to-be-announced: a contract to buy or sell agency MBS at a future date, with the exact pools named later. It is a forward, so it sits in derivatives rather than in debt, and a plain balance-sheet debt-to-equity figure misses it entirely. A REIT holding most of its exposure through long TBAs would look barely levered on GAAP debt while carrying the same interest rate and spread risk as one holding the bonds outright. Economic and at-risk leverage both pull that exposure back in, which is why they are the lines to read and a debt-to-equity ratio you build yourself is not.
Hedging shows up in the spread rather than as its own line. AGNC’s FY2025 net interest spread was 1.92%, after TBA and swap costs and excluding catch-up premium amortisation. Annaly’s FY2025 spread averaged about 1.45% on the same exclusion basis (1.35%, 1.47%, 1.50%, 1.49% by quarter). Hedge drag is the price paid for a steadier book when rates and prepayment speeds move.
The 7–8× Range, and What It Does Not Tell You
For screening, agency books typically sit around 7–8× on at-risk-style metrics. AGNC’s 7.2–7.6× fits. Annaly’s 5.6–5.8× sits below it because Annaly is genuinely running a lighter book against a mixed portfolio, not because the definition flatters it.
| Leverage style | FY2025 range | Applies to |
|---|---|---|
| At-risk (AGNC-style) | 7.2–7.6× | AGNC, and the 7–8× screening range |
| Economic (NLY-style) | 5.6–5.8× | NLY, unless you rebuild peers on it |
| Debt-to-equity you build yourself | Not filed | Misses TBA exposure; do not substitute |
The range only holds for agency paper. Agency MBS carry a guarantee from Fannie Mae or Freddie Mac, so the holder takes rate and prepayment risk but almost no credit risk, and lenders accept them at small haircuts. Nothing about 7× transfers to a book of commercial mortgage loans, where the borrower can default and the collateral has no guarantee behind it. A hybrid or CRE lender at 3× can be carrying more risk of permanent loss than an agency book at 8×. Lower leverage is only safer when the thing being levered is the same.
Rithm Capital, the listed hybrid, does not publish an economic leverage line comparable to Annaly’s or AGNC’s, so there is no like-for-like leverage rank across the sector to be had. Read its segments instead.
Book Value Sensitivity at Leverage
Leverage amplifies mark-to-market moves into book value per share. Wider MBS spreads cut asset values whatever Treasury yields do, and the loss lands in equity at the leverage multiple.
Spreads move enough to matter. AGNC reported the current-coupon MBS spread at 124 bps on 31 March 2026, well in from a stress peak near 160 bps in April 2025. That narrowing went the REITs’ way, and the same 36 bps in the other direction, at 7× leverage, would take a large bite out of book rather than trimming a quarter of carry.
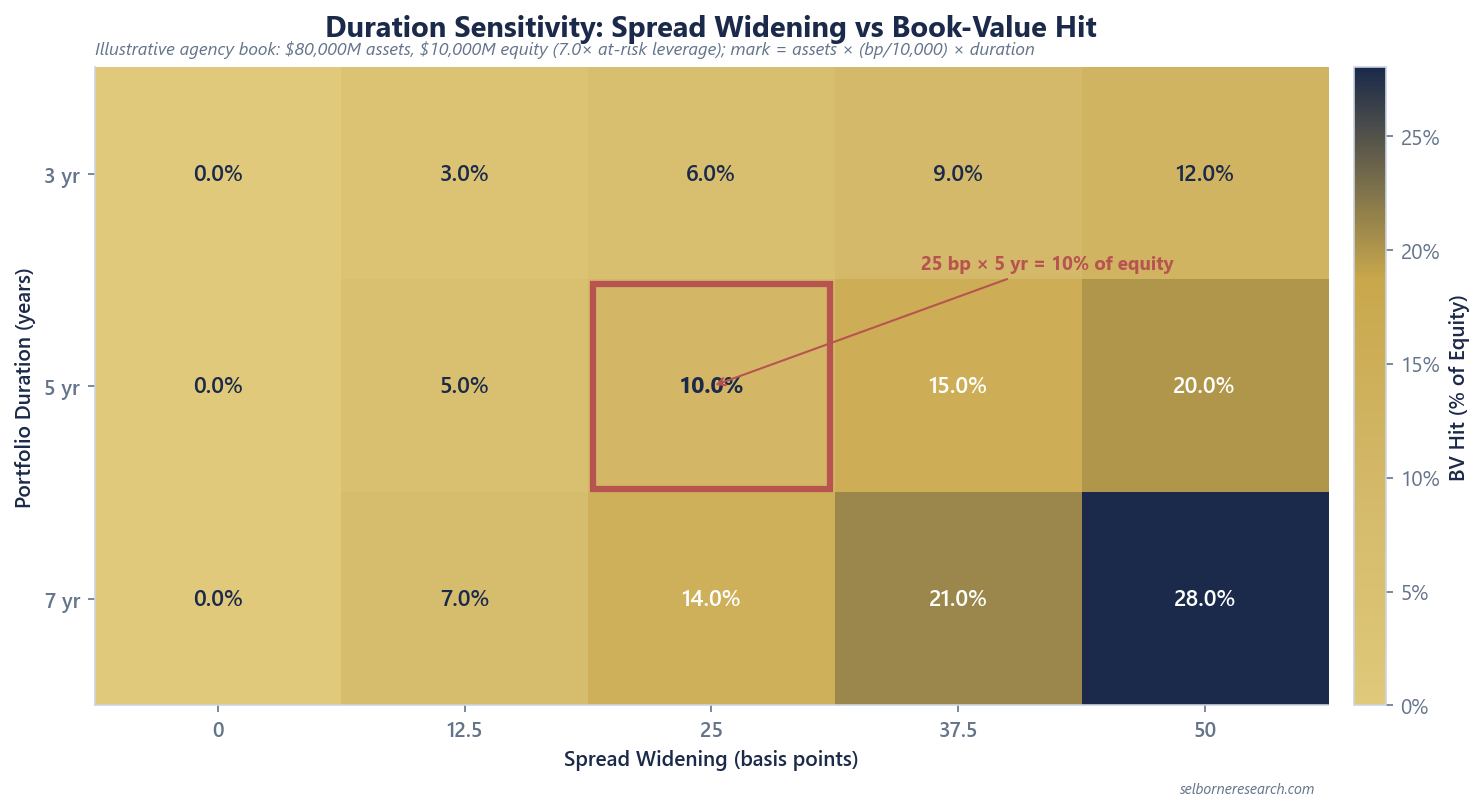
The chart shows the book value hit as a percentage of equity across spread widenings and portfolio durations at 7× leverage. The marked point, a 25 bp widening on a five-year book, lands near 10% of equity.
Worked Mini-Example: 25 bp × 5 Years × 7× Leverage
Illustrative inputs, chosen for round arithmetic rather than to describe any filer:
| Input | Value |
|---|---|
| Common equity | $10.0B (500M shares × $20.00 BVPS) |
| At-risk leverage | 7.0× |
| MBS exposure | $80.0B (equity plus 7× borrowings, TBAs included) |
| Net interest spread | 1.50% |
| Operating expense | $150M/year |
| Portfolio duration | 5.0 years |
Core earnings: $80.0B × 1.50% − $0.15B = $1.05B, or $2.10/sh on 500M shares.
Dividend: $1.90/sh, so coverage of about 1.10× on core earnings.
Book value mark from a 25 bp spread widening: 0.25% × 5.0 years × $80.0B = $1.0B, which is 10% of the $10.0B equity.
A spread move that small, over a few sessions, wipes out roughly a year of spread earnings. It also shrinks the collateral behind the repo book by $1.0B, which is when the margin calls arrive. Faster prepayment shortens effective duration and changes the arithmetic mid-quarter, usually in the direction of a smaller mark and a lower reinvestment yield.
What Hedging Fixes, and What It Does Not
Swaps hedge the wrong half of the problem for the example above. They protect against Treasury yields moving. They do nothing about the spread of mortgages over Treasuries, so if yields sit still and MBS cheapen by 25 bp, the full loss reaches book value. That gap between the exposure and the instrument hedging it is basis risk, and on an agency book it is the main uninsured exposure.
Which is why a hedge ratio near 100% does not mean the book is protected. It means the notional value of the hedges is close to the notional value of the funding. It says nothing about spread risk. It also assumes the hedge and the MBS move together in duration, and they do not: mortgages extend when rates rise and shorten when rates fall, always the unhelpful way round, so a hedge sized for today is short of the mark in a sell-off and too large in a rally.
Read leverage alongside the spread level and its trend, the gap between experienced and projected prepayment speed, and the book value path. Those tell you whether the hedge book actually delivered. For how the underlying businesses differ, see agency versus hybrid mortgage REITs.
When the Leverage Number Falls
A falling ratio is usually read as prudence, and sometimes it is. It can also be the aftermath: a REIT that sold assets to meet margin calls repays repo as it goes, and reports lower leverage next quarter on a smaller book. So read the ratio beside book value per share. Leverage down with book holding is a choice. Leverage down with book down is a consequence.
A small spread move takes a large bite out of book value. The primer sizes that across an erosion grid.
The Excel model is the primer's two worked valuations live across 13 sheets: change the spread, leverage or cost of equity and the valuation moves.
Frequently Asked Questions
- What leverage do agency mortgage REITs run?
- Around seven to eight times equity on at-risk-style company metrics, but the label matters more than the number. Annaly reported 5.6x economic leverage at 31 December 2025; AGNC reported 7.2x at-risk leverage. The definitions differ a little, but not enough to explain the gap: AGNC really does run the harder book, and it can because every bond it owns carries a government-sponsored guarantee.
- What is economic leverage versus at-risk leverage?
- Annaly divides recourse debt plus the cost of TBA positions and net forward purchases by total equity, which includes preferred. AGNC divides repo, consolidated vehicle debt and net TBA cost by total equity less goodwill, and its goodwill is small, so the two denominators are close. Preferred comes out of the tangible net book value per share, not out of its leverage denominator. The definitions therefore explain very little of the gap. Both include TBAs, which is why either beats a balance-sheet debt-to-equity figure: TBAs are forward contracts that carry real MBS exposure without appearing as debt.
- How does leverage affect book value sensitivity?
- Leverage multiplies mark-to-market moves on the assets into equity. A 25 basis point spread widening on a five-year duration portfolio at 7x leverage takes roughly 10% off book value. Interest rate swaps do not offset that, because they hedge rate moves rather than the spread of mortgages over Treasuries. Swaps protect the book when yields move and the spread holds; they do nothing when the spread itself widens.
- What happens to a mortgage REIT in a margin call?
- Repo lenders hold the MBS as collateral and mark it daily. When prices fall, the lender demands cash or extra collateral the same day. The REIT pays from its liquidity buffer, and if the move is large enough it sells MBS to raise the cash, into the market that has just fallen. That crystallises the loss into book value permanently. In March 2020 several mortgage REITs could not meet agency repo margin calls and sold most of their portfolios; some never rebuilt them.