P/BV vs ROE for Insurers
Why insurers are valued on ex-AOCI price-to-book paired with ROE, verified Jun 2026 comps from Progressive to AIG, and the steady-state ROE over COE identity.
Educational analysis for professional use. This guide is not investment advice or a recommendation to buy or sell any security, and it is not personalised.
Insurers Are Priced on Book and Sustainable ROE
The market does not value Chubb like a software company. It asks what return the franchise earns on tangible economic book, and what multiple of that book shareholders will pay. Price-to-book value (P/BV) on an ex-AOCI (accumulated other comprehensive income) or adjusted basis, paired with return on equity (ROE), is the standard insurer valuation lens. The same pairing applies to banks via P/TBV and ROTCE; see our bank P/TBV guide for the sibling framework.
Bond-portfolio AOCI swings GAAP book without changing underwriting quality. Strip it out for cross-comp work. Label differences matter: Chubb reports BV ex-AOCI, Travelers adjusted BVPS, AIG adjusted book value, MetLife adjusted BVPS, Prudential GAAP BV excluding AOCI, Progressive derived ex-AOCI.
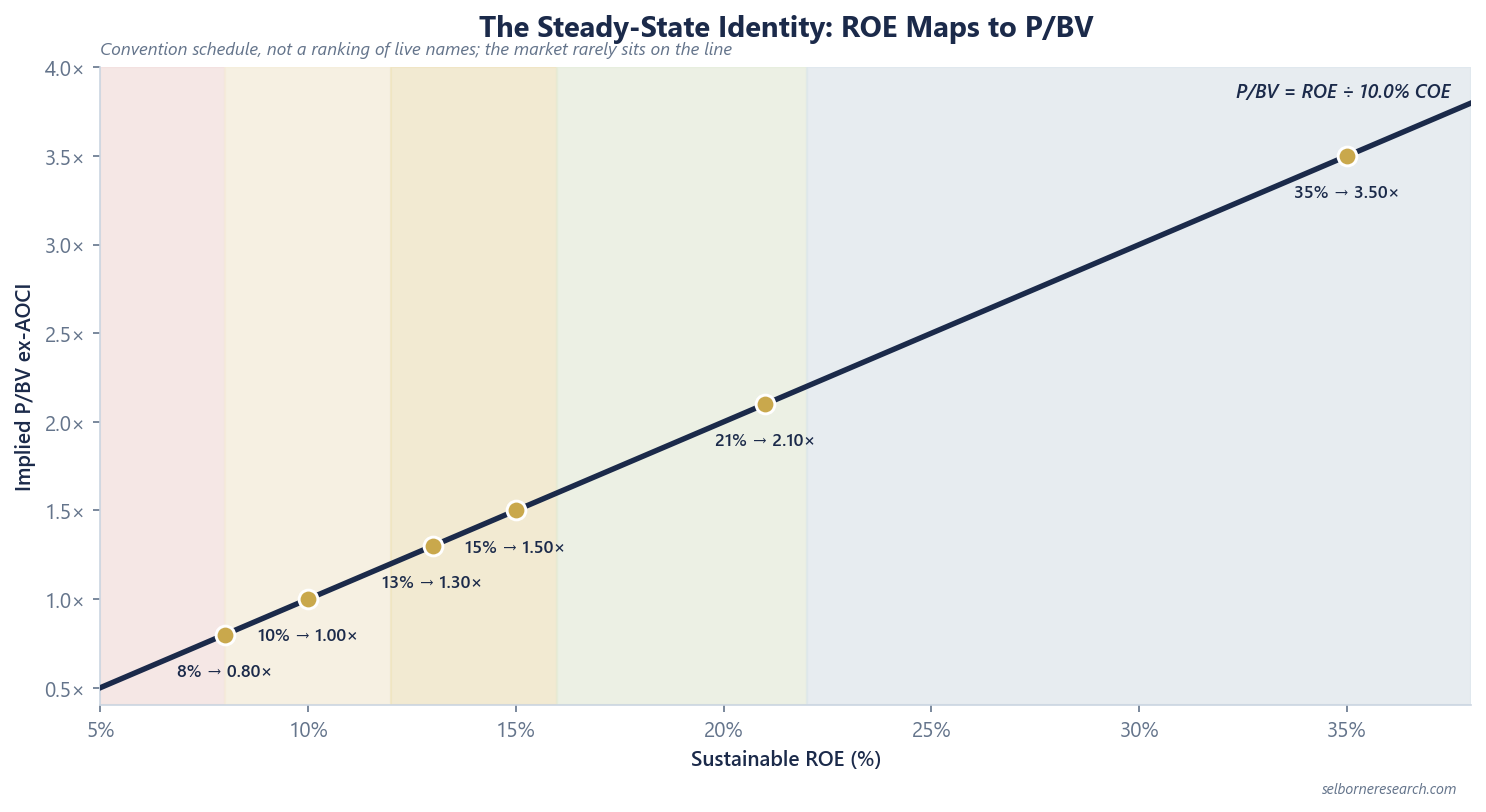
The ROE-to-P/BV Schedule
Rather than rank live insurers on their multiple, read the identity as a convention schedule: at an illustrative 10% cost of equity, a sustainable ROE maps onto an implied price-to-book.
| Sustainable ROE | Implied P/BV at 10% COE (ROE ÷ COE) |
|---|---|
| 8% | ~0.80× |
| 10% (= COE) | ~1.00× |
| 13% | ~1.30× |
| 15% | ~1.50× |
| 21% | ~2.10× |
| 35% | ~3.50× |
The market rarely sits on the line. A personal-lines franchise with best-in-class underwriting and investment leverage at scale trades above the multiple its ROE implies; a name earning below its cost of equity, or one the market doubts on reserve adequacy, trades below it. What separates them is the durability of the return, not one reported year.
Disclose which ROE variant you pair with P/BV. A comprehensive-income ROE and a core operating ROE can each tell a different story from headline GAAP, and the multiple you set against the wrong one will mislead.
House Bands: Sustainable ROE to P/BV
House bands, tying sustainable ROE to a P/BV range:
| Sustainable ROE | Typical P/BV band | What sits here |
|---|---|---|
| <8% | Discount below ~1.0× | Sub-cost-of-equity returns, unless a turnaround is priced in |
| 8–12% | ~0.9–1.3× | Returns around the cost of equity |
| 12–16% | ~1.3–1.8× | Solid underwriters earning above their cost of equity |
| 16–22% | ~1.8–2.5× | Strong franchises on mid-to-high-teens returns |
| >22% | >2.5× (quality outliers higher) | Exceptional underwriting plus investment leverage at scale |
Bands are screening frames, not tight fair-value ranges. When P/BV and ROE sit in different bands, reserve adequacy doubt and turnaround optionality are the usual explanations. Less often, buyback capacity or a comprehensive-income ROE outlier pulls the multiple away from earnings power.
The Steady-State Identity
At steady state, a simplified check:
P/BV ≈ ROE ÷ COE
These pages use 10.0% as an illustrative nominal cost of equity, the return a shareholder needs to be paid for the risk. A 15% ROE implies ~1.50× on this line; a franchise the market trusts trades at a modest premium to that. A 35% ROE implies ~3.50×, and an exceptional underwriter trades above even that.
The logic is simple enough to hold in your head. A company earning exactly its cost of equity is worth its book value, because a pound retained produces exactly the return a shareholder could get elsewhere. Earn more and the book compounds faster than the discount rate, so the market pays a premium; earn less and it pays a discount. Published P&C work bears this out, with discounts appearing where the market doubts reserve adequacy or the durability of the return.
Worked Example: ROE to Implied P/BV
Take the illustrative P&C insurer used across these guides: FY2025 pre-tax earnings of $2,950m, 21% tax rate, net income ~$2,331m on $18,000m average common equity.
| Step | Calculation | Result |
|---|---|---|
| ROE | $2,331m ÷ $18,000m | ~12.9% |
| Implied P/BV at 10% COE | 12.9% ÷ 10.0% | ~1.29× |
| Implied price | $36.00 BVPS × 1.29× | ~$46.44/sh |
At ~1.29× implied P/BV, the illustrative name lands in the 12–16% ROE band (~1.3–1.8×). Underwriting quality, reserve credibility, and capital return would pull a live multiple above or below that midpoint.
P/BV Without Underwriting Context Fails
P/BV alone does not tell you whether returns are durable. Pair it with the combined ratio scoreboard: a 15% ROE supported by a 98% combined ratio and weak reserving is a different bet than 15% ROE at 88% combined ratio with conservative reserves.
For life names, ROE blends spread income and new-business economics rather than underwriting margin. A life insurer’s GAAP ROE and its operating ROE can sit several points apart, so the multiple you set against it depends on which return you judge sustainable; spread businesses still map into the same bands.
What the Bands Show
A name earning below its cost of equity can trade below book, while an exceptional underwriter runs well above 3× book, and those two brackets stretch the range. Most diversified P&C names cluster between 1.5× and 2.0× P/BV on mid-teens to low-20s ROE. Fair P/BV is the wrong question; sustainable ROE on the right book basis, and whether the market credits it, is the one that matters.
Return on equity over cost of equity is a screening shortcut. The primer builds the same multiple from a year-by-year book roll-forward.
The Excel model is the primer's three residual-income valuations live across 13 sheets: change the combined ratio, the spread or the cost of equity and the justified P/BV moves.
Frequently Asked Questions
- Why do insurers trade on price-to-book?
- Insurer equity research pairs price-to-book value (P/BV) with return on equity (ROE) because book value accumulates retained underwriting and investment earnings, and the market capitalises sustainable ROE as a multiple of that book. A company earning exactly its cost of equity is worth its book value; the multiple rises above 1.0x as the return exceeds that hurdle, and falls below when reserve adequacy or the durability of the return is doubted.
- What book value basis should I use for insurers?
- Use book value per share excluding accumulated other comprehensive income (AOCI) or adjusted BVPS where disclosed. Bond-portfolio unrealised gains and losses swing GAAP book without changing underwriting economics. Chubb, Progressive, Travelers, AIG, MetLife, and Prudential all disclose ex-AOCI or adjusted variants; cross-comp on that basis.
- What P/BV is fair for a 15% ROE insurer?
- House bands map 12–16% sustainable ROE to roughly 1.3–1.8× P/BV. At the illustrative 10.0% cost-of-equity steady-state check, 15% ROE implies ~1.50× P/BV; franchise quality, underwriting durability and capital return then pull the live multiple above or below that line.
- Why can an insurer trade below book on GAAP ROE?
- Because the market prices sustainable returns, not one reported year. A GAAP ROE below the cost of equity maps to a discount to book on the steady-state identity, and reserve-adequacy doubt or restructuring execution risk deepens it. Where a core operating ROE sits above the GAAP figure and the market comes to trust it as durable, the discount narrows. Read the ROE variant the multiple is being paired with before drawing the conclusion.