Fee-Related vs Distributable Earnings
How alternative asset managers split recurring fee-related earnings from distributable earnings, why proxy labels do not line up against Blackstone DE.
Educational analysis for professional use. This guide is not investment advice or a recommendation to buy or sell any security, and it is not personalised.
FRE Is the Recurring Core; DE Adds Realisations
Alternative asset managers publish two earnings layers that equity research treats differently. Fee-related earnings (FRE) capture the recurring fee engine: management and advisory fees plus recurring fee-related performance revenues, less fee-related compensation and operating expenses. Distributable earnings (DE) add realised carry and principal investments on top.
The market pays far more for a dollar of fee-related earnings than for a dollar of realised carry, and that spread is the whole reason the split is worth learning. A management fee on committed capital arrives whether or not anything is sold; a realisation depends on an exit happening at a price. So two managers earning the same headline number can be worth very different amounts, depending on which layer the number came from. DE still matters for dividend capacity, but it is the wrong denominator to hang a multiple on. Before applying the P/FRE lens, work out how much of the earnings is annuity and how much is exit.
Blackstone’s Construction: FRE, Realisations, Then Tax
Blackstone is the cleanest template because it files both labels with an explicit bridge. Fee-related earnings plus net realisations (realised performance fees and realised principal investments, less performance compensation) gives total segment distributable earnings. Taxes and related payables come out of that to reach the DE Blackstone headlines.
| Blackstone FY2025 | Amount |
|---|---|
| Fee-related earnings | $5,737.5M |
| Net realisations | $2,145M |
| Taxes and related payables | −$771M |
| Distributable earnings | $7,110.9M |
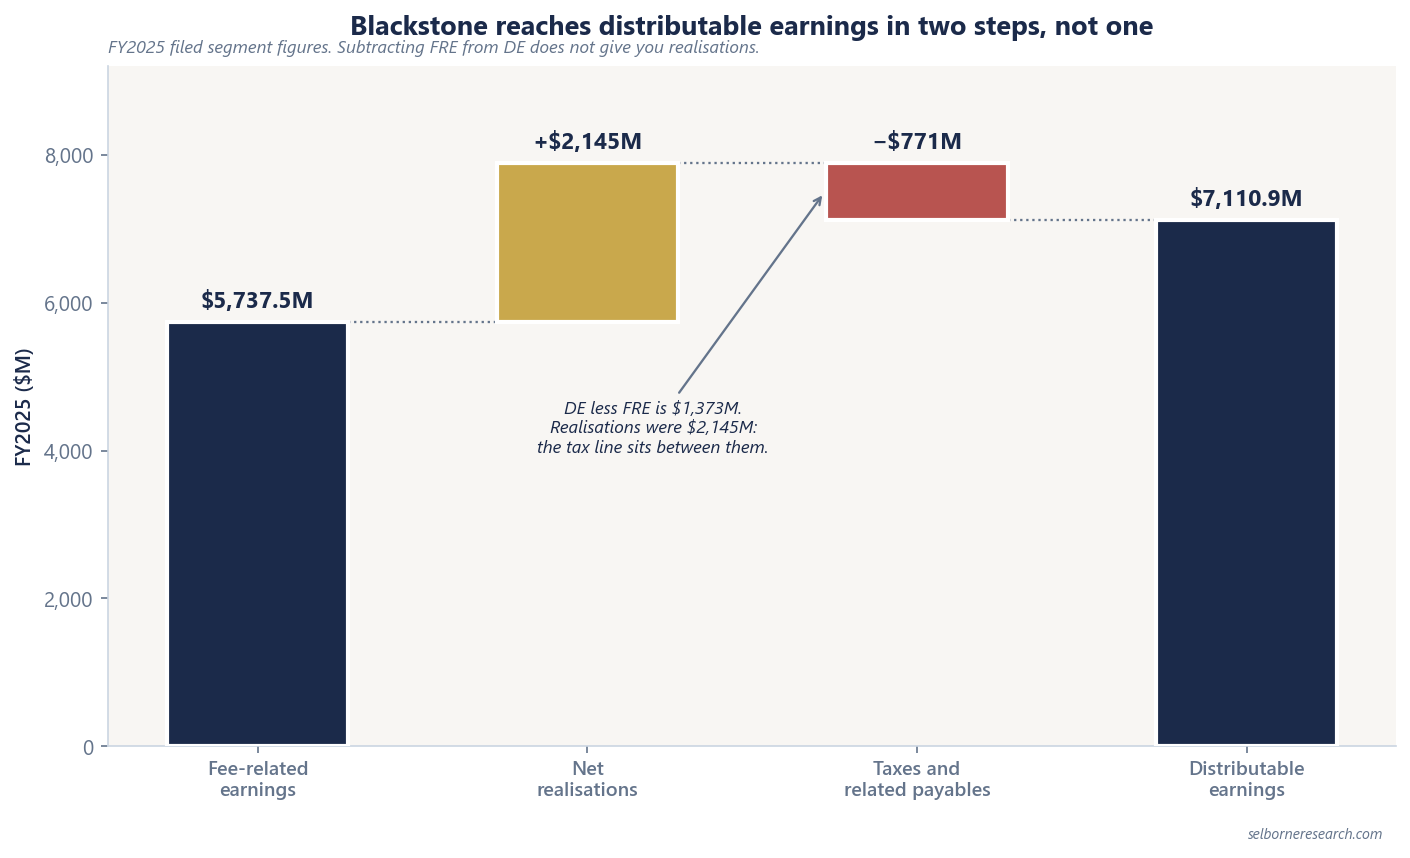
Do not read DE minus FRE as the realisation layer. That subtraction gives ~$1.4B, because the tax line sits between them, and it understates realisations by about a third.
Net realisations are real cash, and they are not the same size every year. That swing is the reason the two layers get valued differently: realisations were about $1.4B in FY2024 and $2.1B in FY2025, up roughly half, while the fee engine grew about 9% (FRE $5.28B to $5.74B).
The Proxy Label Problem
Only Blackstone and Brookfield Asset Management headline a firm-wide “DE” in the six-name comp set. Carlyle files one too, but as a pre-tax segment line with an after-tax figure per share, so it is not on the same basis as either. Everyone else uses a different metric entirely. Treating these as interchangeable with Blackstone DE creates false precision.
| Company | FY2025 headline proxy | Filed DE? | Notes |
|---|---|---|---|
| Blackstone | DE $7.1B | Yes | FRE + net realisations, less tax |
| Brookfield AM | DE $2.7B | Yes | Own construction |
| KKR | KKR TOE $5.0B | No | Includes insurance operating earnings |
| Apollo | Apollo ANI $5.2B | No | Renamed from DE in May 2022; FRE + SRE + PII + interest/taxes |
| Ares | After-tax Realized Income $1.7B | No | Realised-income focus |
| Carlyle | Pre-tax DE $1.7B ($4.02/sh after-tax) | Partial | Segment table is pre-tax; per-share is after-tax |
KKR TOE ($5.0B) looks comparable to Blackstone DE ($7.1B) in a table, but KKR TOE includes insurance and strategic holdings operating earnings, not just FRE plus net realisations. Apollo ANI ($5.2B) embeds Retirement Services (Athene spread) earnings alongside asset management FRE. Ares After-tax Realized Income ($1.7B) is a narrower realised-income measure than Blackstone DE.
FRE Margins: Operating Leverage on the Recurring Book
FRE margin (FRE divided by fee-related revenues, issuer-defined) shows pricing power and cost discipline on the recurring base. Verified FY2025:
| Company | FRE | FRE margin |
|---|---|---|
| KKR | $3.7B | 69% |
| Blackstone | $5.7B | ~58.3% |
| Brookfield AM | $3.0B | 58% |
| Apollo | $2.5B | 56.6% (asset management) |
| Carlyle | $1.2B | 47% |
| Ares | $1.8B | 41.7% |
Higher FRE margin does not automatically mean higher P/FRE; perpetual-capital mix and growth expectations matter. But margin explains why two managers with similar AUM can produce very different FRE dollars.
Worked Example: Blackstone’s FY2025 DE Bridge
Start with Blackstone’s filed FY2025 segment figures:
- FRE: $5,737.5M (~$5.7B)
- Net realisations: $2,145M
- Taxes and related payables: −$771M
- DE: $5,737.5M + $2,145M − $771M = $7,111M (~$7.1B)
- Realisation share of DE: $2,145M ÷ $7,110.9M = ~30%, not the ~19% the FRE-to-DE gap suggests
At Jun 2026 market cap ~$147.2B (1,228.8M DE Shares × $119.80, the share count Blackstone divides its per-share FRE/DE by), implied multiples are ~25.7× on FRE and ~20.7× on DE.
One warning on that pair, because it trips people up. P/DE will always be lower than P/FRE whenever DE is the larger number, since both multiples divide the same market cap. The 20.7 and the 25.7 are not two separate judgements the market has made about two earnings streams. Their ratio, 80.5%, is just FRE divided by DE wearing a different hat. It tells you about the earnings mix, never about how the market prices carry. Backing out what the market pays for realisations takes a sum-of-the-parts, not a comparison of two multiples built on one price.
What Each Proxy Actually Captures
Each of the three headline proxies bundles something Blackstone’s DE does not. KKR’s total operating earnings carry insurance and strategic-holdings earnings alongside the fee engine; Apollo’s adjusted net income adds spread-related earnings from Athene and principal investing income; Carlyle files its segment number pre-tax while quoting an after-tax figure per share. Each is a reasonable measure of its own business. None is FRE plus net realisations.
Working out what a given filer’s number contains, and putting several of them on one basis, is a procedure in itself: our guide to distributable earnings by firm walks the label, the reconciliation, the tax basis and the share base name by name.
Using FRE and DE in Screening
Identify the filed label on each name before you compare lines, and normalise the per-firm bases first. FRE versus the proxy tells you how much of headline earnings is recurring versus realisation-driven. Apply P/FRE as the primary valuation lens and use P/DE (where filed) as a cross-check. See our alternative manager valuation guide for the comp ladder and convention bands.
For stock-level FRE/DE decomposition, see our Blackstone, KKR, and Carlyle Group profiles. Perpetual-capital mix affects how much of FRE is duration-backed; our AUM and perpetual capital guide covers that layer.
What Matters Most
FRE is the metric the market capitalises; DE tells you what was actually distributable last year and how much of it came from selling something. Blackstone’s FY2025 bridge (FRE $5.7B, DE $7.1B) is the template, and only Brookfield AM headlines the same firm-wide label. KKR TOE, Apollo ANI, and Ares After-tax Realized Income are useful issuer metrics; they are not Blackstone DE under another name. If you take one habit from this page, take the one that costs nothing: before comparing any two of these numbers, say out loud which of them contains realised carry.
Alternative Asset Managers Primer
FRE and DE are two earnings layers, not a valuation. The primer capitalises each one into a value per share.
The Excel model is the primer's two worked valuations live across 12 sheets: change fee-paying AUM, FRE margin or the fundraising rate and the valuation moves. It holds two company slots, one per worked case, not a full peer table.
Frequently Asked Questions
- What is fee-related earnings (FRE) for an alternative asset manager?
- Fee-related earnings are recurring fee profits: management and advisory fees plus recurring fee-related performance revenues, less fee-related compensation and operating expenses. Blackstone defines FRE as profits from revenues measured and received on a recurring basis and not subject to future realisation events. FY2025 verified FRE ranges from $1.2B (Carlyle) to $5.7B (Blackstone).
- How does Blackstone calculate distributable earnings?
- Fee-related earnings plus net realisations (realised performance fees and realised principal investments, less performance compensation) gives total segment distributable earnings; taxes and related payables then come out to reach the filed DE. FY2025: FRE $5.7B plus $2.1B of net realisations, less $0.8B of taxes, equals DE $7.1B. The realisation layer is lumpy, and that is the point: it was about $1.4B in FY2024 and $2.1B in FY2025, up roughly half, while the fee engine grew about 9%. Only Blackstone and Brookfield Asset Management headline a firm-wide DE in the comp set; Carlyle files a pre-tax segment DE with an after-tax per-share figure.
- Why do KKR TOE and Apollo ANI differ from Blackstone DE?
- KKR reports Total Operating Earnings ($5.0B FY2025), Apollo reports Adjusted Net Income ($5.2B), and Ares reports After-tax Realized Income ($1.7B). None of these is constructed as FRE plus net realisations in the Blackstone sense. Comparing them directly to Blackstone DE without relabelling overstates comparability.
- Why does the market pay more for fee-related earnings than for carry?
- A management fee on committed capital arrives whether or not anything is sold. Realised carry depends on an exit happening at a price, so it is cyclical and it can be absent for years. Two managers reporting the same headline earnings are therefore worth different amounts depending on which layer produced them. One thing this does not show up as: a firm quoting a lower P/DE than P/FRE. Blackstone is at ~25.7× P/FRE and ~20.7× P/DE at Jun 2026, but both divide the same market cap, so their ratio is only FRE divided by DE and says nothing about how carry is priced.