AUM, Fee-Paying AUM and Perpetual Capital
How total AUM, fee-paying AUM and perpetual capital differ across alternative managers, and why Brookfield platform AUM is not the fee base.
Educational analysis for professional use. This guide is not investment advice or a recommendation to buy or sell any security, and it is not personalised.
Total AUM Overstates What Pays Fees Today
Alternative managers headline total assets under management (AUM), but equity research builds FRE forecasts from the fee-paying subset: fee-paying AUM (FPAUM), fee-earning AUM, fee-generating AUM, or fee-bearing capital (FBC). The rule is simple: AUM ≥ FPAUM. Committed capital waiting to be deployed counts in AUM but may not yet earn management fees.
Perpetual capital, a further slice of AUM or FPAUM, sits in indefinite-term vehicles rather than traditional drawdown funds. Duration of fees and fundraising risk drive valuation premiums on perpetual-heavy platforms. See our alternative manager valuation guide for how the market prices that mix.
Four Labels, One Concept
Issuers use different names for the fee-paying base. When cross-comping, normalise the label before comparing dollars.
| Issuer term | Used by | End-FY2025 (filed) |
|---|---|---|
| Fee-earning AUM | Blackstone, Carlyle | BX $921.7B; CG $337B |
| FPAUM | KKR, Ares | KKR $604B; ARES $384.9B |
| Fee-generating AUM | Apollo | APO $709B |
| Fee-bearing capital | Brookfield AM | BAM $603B |
Each is the subset currently paying management fees. Total AUM is always at least as large.
End-FY2025: AUM vs Fee-Paying Base
| Company | Total AUM | Fee-paying base | FPAUM as % of AUM |
|---|---|---|---|
| Brookfield AM | over $1T platform | $603B FBC | n/a (platform basis) |
| Blackstone | $1,274.9B | $921.7B fee-earning | 72% |
| Apollo | $938B | $709B fee-generating | 76% |
| KKR | $744B | $604B FPAUM | 81% |
| Ares | $622.5B | $384.9B FPAUM | 62% |
| Carlyle | $477B | $337B fee-earning | 71% |
Brookfield is the outlier on presentation: the over $1 trillion platform AUM it headlines spans the broader Brookfield ecosystem, while $603B fee-bearing capital is what BAM actually charges fees on. Do not compare BAM platform AUM to Blackstone total AUM without footnoting the fee-base difference.
Why AUM Exceeds FPAUM: Undeployed Commitments
KKR’s Q3 2024 earnings materials noted $57B of AUM not yet paying fees at 30 Sep 2024. Capital committed to drawdown funds sits in total AUM from the commitment date, but FPAUM typically rises only when capital is invested and begins paying management fees.
That gap matters for forward FRE modelling: fundraising momentum (FY2025 BX inflows $239.4B, KKR new capital raised $129.4B, APO inflows $228B) feeds future FPAUM, but the conversion lag means AUM growth can outpace near-term FRE growth.
Perpetual Capital: Definition and Peer Shares
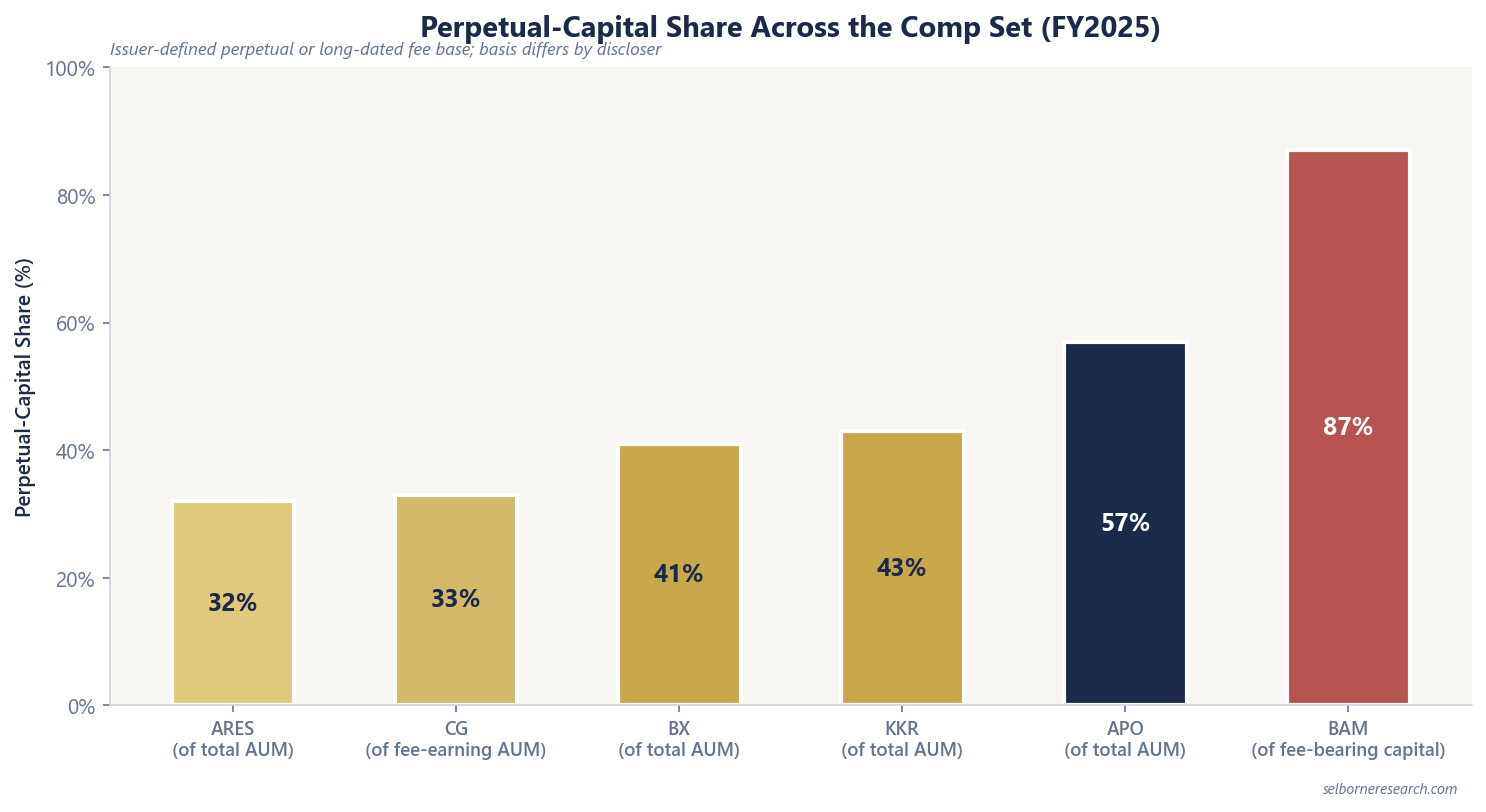
Perpetual capital has no predetermined return-of-capital date. KKR’s definition includes registered funds, unregistered permanent vehicles, listed companies, and insurance companies (Global Atlantic). Insurance balance sheets are indefinite-duration capital; KKR’s Feb 2025 investor presentation embeds Global Atlantic inside the perpetual bucket.
End-FY2025 perpetual shares:
| Company | Perpetual AUM / capital | Share of total | Share of fee-paying base |
|---|---|---|---|
| Brookfield AM | $525B of $603B FBC | n/a (FBC basis) | 87% long-dated/perpetual |
| Apollo | $536B | 57% of total AUM | >70% of fee-generating |
| KKR | $321B | 43% of AUM | 51% of FPAUM |
| Blackstone | $523.6B | 41% of total AUM | 48% of fee-earning |
| Carlyle | $111B fee-earning perpetual | n/a | 33% of fee-earning |
| Ares | $200.0B | 32.1% of total AUM | n/a |
Apollo is the case where the two columns diverge most: 57% of its assets are perpetual, but more than 70% of the assets actually paying fees are. The perpetual vehicles are disproportionately fee-paying, which is the version that matters for the fee stream.
Ares needs a warning label. It reports a 32% perpetual-capital share of AUM and, separately, an 85% figure for funds that are perpetual or long-dated, the broader one sweeping in closed-end credit vehicles with long but finite lives. Both are filed and both are true; they describe different things. Line the 85% up against the strict shares above it and the least perpetual manager in the set reads as the most.
Worked Example: Blackstone’s AUM-to-FPAUM Gap
Blackstone end-FY2025:
- Total AUM: $1,274.9B
- Fee-earning AUM: $921.7B
- Non-fee-earning AUM: $1,274.9B − $921.7B = $353.2B (28% of total)
- Perpetual AUM: $523.6B, or 41% of total; the fee-earning slice of that is $445.8B, which is 48% of the fee-earning base
The $353.2B gap is capital Blackstone manages or advises that is not currently on the fee-earning base: undeployed commitments, co-investment capital, and other non-fee-earning sleeves. FRE of $5.7B in FY2025 ran on the $921.7B fee-earning base, not the full $1.27T headline.
Perpetual Premium and Valuation
Platforms with >50% of fee-paying AUM in perpetual vehicles typically warrant +3–8 P/FRE turns versus drawdown-heavy peers, holding growth and FRE margin constant. End-FY2025 anchors above 50%: KKR (51% of FPAUM), Apollo (>70% of fee-generating), Brookfield (87% of FBC).
Jun 2026 P/FRE partly reflects this: Brookfield ~25.6× and Apollo ~33.2× sit in the mega-cap perpetual band (25–35×), while Carlyle ~13.1× sits in the diversified mid-scale band (12–18×) on a 33% perpetual fee-earning share. Do not read the whole of Apollo’s gap as a perpetual premium, though. Its market cap also capitalises Athene’s insurance spread earnings, which are not in the FRE it is being divided by.
Fundraising Momentum: Not Summable Across Peers
FY2025 capital-raising disclosures differ by issuer definition:
| Company | FY2025 metric | Amount |
|---|---|---|
| Blackstone | Inflows | $239.4B |
| Apollo | Inflows | $228B |
| KKR | New capital raised | $129.4B |
| Ares | Gross new capital / net inflows | $113.2B / $107.7B |
| Brookfield AM | Capital raised | $112B |
| Carlyle | Inflows | $53.7B |
Do not sum these into a “sector total.” Inflows, new capital raised, and gross commitments measure different things. Use each issuer’s metric for that company’s forward FPAUM build only.
For issuer-level detail, see our Brookfield Asset Management, Apollo Global Management, and Ares Management profiles. The FRE vs DE guide covers how recurring earnings flow from the fee-paying base.
What Matters Most
Headline AUM is marketing scale; FPAUM is what pays fees today; perpetual share tells you how much of that fee base resets on a drawdown calendar. Brookfield’s trillion-dollar-plus platform versus $603B fee-bearing capital is the starkest reminder that the biggest number in the press release is not always the fee base.
Alternative Asset Managers Primer
Perpetual share is a mix statistic. The primer rolls that fee base forward ten years into a FRE forecast.
The Excel model is the primer's two worked valuations live across 12 sheets: change fee-paying AUM, FRE margin or the fundraising rate and the valuation moves. It holds two company slots, one per worked case, not a full peer table.
Frequently Asked Questions
- What is the difference between AUM and fee-paying AUM?
- Total AUM includes all assets the manager advises or manages; fee-paying AUM (FPAUM, fee-earning AUM, fee-generating AUM, or fee-bearing capital) is the subset on which management fees are currently earned. AUM is always greater than or equal to FPAUM because committed but undeployed capital can sit in AUM without yet paying fees. KKR disclosed $57B of AUM not yet paying fees at 30 Sep 2024.
- What counts as perpetual capital at alternative managers?
- Perpetual capital sits in indefinite-term vehicles: registered funds, permanent capital vehicles, listed companies, and insurance balance sheets. KKR includes Global Atlantic inside its perpetual capital bucket ($321B, 43% of total AUM at end-FY2025). Brookfield reports 87% of fee-bearing capital ($525B of $603B) in long-term, permanent or perpetual strategies.
- Why does Brookfield report over $1 trillion of platform AUM but only $603B fee-bearing capital?
- Brookfield Asset Management earns fees on fee-bearing capital ($603B at end-FY2025), not on the full Brookfield platform of over $1 trillion, which includes capital managed by affiliated entities where BAM does not charge management fees. Comparing BAM fee-bearing capital to Blackstone total AUM without this distinction misstates scale.
- How does perpetual-capital share affect valuation?
- Platforms with more than 50% of fee-paying AUM in perpetual vehicles typically warrant +3–8 P/FRE turns versus drawdown-heavy peers, holding growth and FRE margin constant. End-FY2025 anchors: KKR 51% of FPAUM perpetual, Apollo more than 70% of fee-generating AUM perpetual, Brookfield 87% of fee-bearing capital long-dated/perpetual.