How Alternative Asset Managers Are Valued
P/FRE as the primary valuation lens for alternative asset managers, a verified Jun 2026 comp ladder from Carlyle to Apollo, and P/DE cross-checks.
Educational analysis for professional use. This guide is not investment advice or a recommendation to buy or sell any security, and it is not personalised.
P/FRE Is the Primary Lens
Generic DCF misses how equity research values alternative asset managers. The starting question is what multiple of fee-related earnings (FRE) the market pays for the recurring fee engine, then whether distributable earnings (DE) or accrued carry justify a premium or discount to that base.
P/FRE = market cap ÷ LTM FRE. FRE is recurring; it does not depend on exit timing. That is why P/FRE is the headline multiple, with P/DE as a cross-check where DE is filed. Our FRE vs DE guide covers the earnings split.
Why the Multiples Spread So Wide
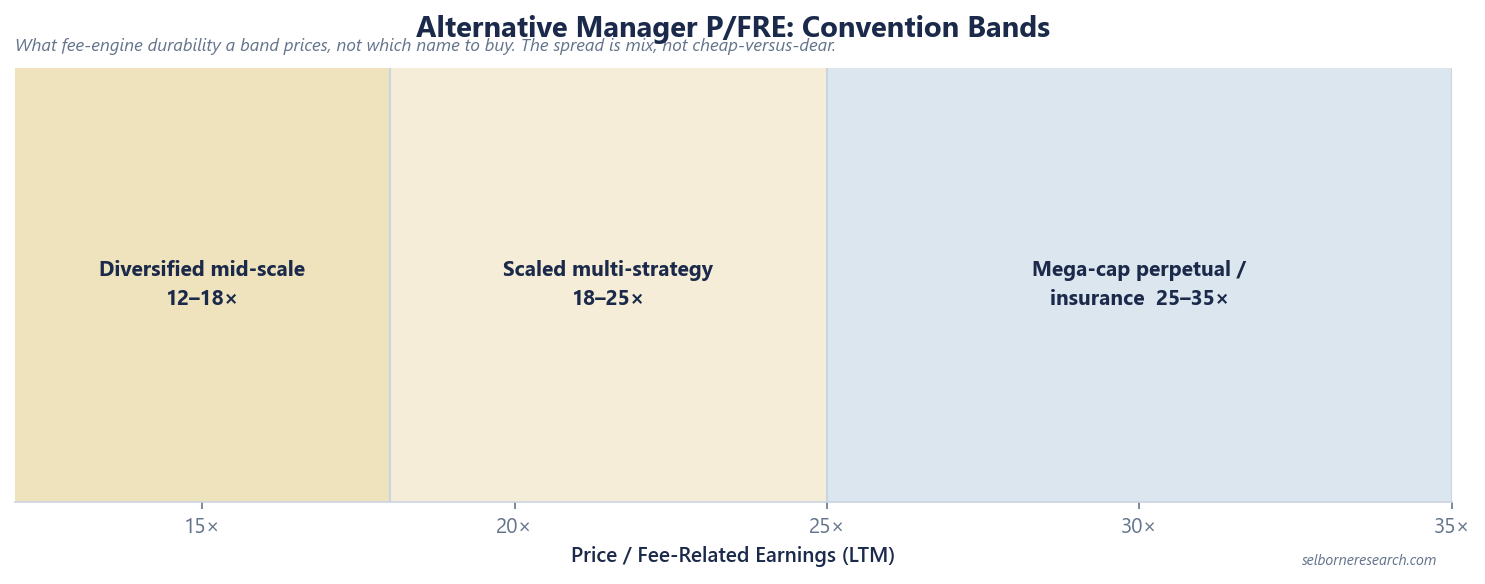
P/FRE runs from the low teens to the low thirties across the large managers, wide for a sector that looks homogeneous in headlines. The spread is not a cheap-versus-dear ranking: perpetual-capital mix, insurance integration, FRE margin and growth expectations pull the multiples apart, and a low multiple usually marks a drawdown-heavy fee base rather than a bargain.
One mechanical trap sits inside every one of these multiples: the market cap in the numerator. Filers divide per-share FRE and DE by a share count broader than the GAAP common count (common plus partnership units, exchangeable securities and unvested participating shares), because the earnings are firm-wide. Build the cap on the GAAP common count alone and the multiple collapses, manufacturing a phantom discount to every scaled peer. Always take the share count from the filer’s own per-share reconciliation; the worked example below shows the ten-second check.
Desk Convention Bands
These bands are house views, cross-checked against third-party research (Piper Sandler M&A review, BRG Q4 2025 GP report).
| Band | P/FRE range | What sits here |
|---|---|---|
| Diversified mid-scale | 12–18× | Drawdown-heavy fee base, lower perpetual share |
| Scaled multi-strategy | 18–25× | Broad platform, growing perpetual mix |
| Mega-cap perpetual/insurance | 25–35× | High perpetual share, often an insurance balance sheet capitalised alongside the fee engine |
A credit specialist can trade in the mega-cap band despite a narrower strategy: the market pays for fee-engine durability, not just AUM headline scale or strategy breadth.
Third-party context (published universe multiples, not a ranking of named stocks):
| Source | Finding | As-of |
|---|---|---|
| Piper Sandler M&A review | 10–15× mono-line; 25×+ diversified platforms | Dec 2024 pricing |
| Piper Sandler PSC report | U.S. alternatives P/DE median 27.7× (~15–42× range) | Jan 2025 |
| BRG Q4 2025 GP report | Public P/FRE avg 34.4× (range 16.4–55.4×); P/DE avg 23.3× | Dec 2025 |
BRG’s 34.4× average sits above the range the bands describe because it includes a broader public GP universe. Use it as sector context, not as a fair-value target for any single name.
P/DE Tells You About Earnings Mix, Not About Pricing
Where DE is filed, running P/DE alongside P/FRE is worth doing, as long as you know what the comparison can and cannot show.
Both multiples divide the same market capitalisation, so their ratio reduces to FRE ÷ DE. A P/DE that prints below a manager’s P/FRE is not the market marking its carry down; it is simply that FRE is that fraction of DE, with realisations net of tax making up the rest. A P/DE above the P/FRE, which happens where a manager’s DE comes in below its FRE because cash taxes come out and almost nothing is added back, is not the market paying up for realisations either. The gap is an earnings-mix statistic, not a valuation signal.
What it does tell you is how much of a firm’s distributable stream is exit-dependent, which is worth knowing before you decide what multiple the firm deserves. It just cannot be used to work out what the market is already paying for carry. That needs a sum-of-the-parts: value the fee engine on a multiple, value the carry balance separately at a haircut, and see what is left over against the share price. Our net accrued carry guide sets out that split.
What Drives Multiple Dispersion
The low-teens and low-thirties ends of the range coexist because perpetual mix, insurance integration, and carry accrual pull multiples in different directions.
Perpetual-capital share is the first split. Desk convention: >50% of fee-paying AUM in perpetual vehicles warrants +3–8 P/FRE turns versus drawdown-heavy peers. A manager with more than 70% of its fee-generating AUM in perpetual vehicles sits in the top band; one with a third of its fee base perpetual sits toward the bottom.
Insurance integration adds a second axis, and it needs handling with care. Apollo’s Athene engine and KKR’s Global Atlantic earn a spread on an insurance balance sheet, which is a second business sitting beside the fee business. The share price capitalises both. FRE does not contain either: Apollo’s $2.5B of FRE is asset management alone, against a $5.2B headline that includes spread earnings, and KKR’s $3.7B of FRE sits inside $5.0B of total operating earnings.
So a chunk of an insurance-augmented manager’s multiple is not the market paying up for its fee engine. It is a whole-firm price divided by a part-firm earnings number. Some premium is genuinely there, because captive insurance capital never has to be re-raised and it gives the credit business somewhere to put what it originates. But you cannot read the size of that premium off the multiple, and setting an insurance-augmented multiple against a pure-fee one as though both denominators covered the same ground overstates the gap.
Accrued carry is optionality, not recurring FRE. Carlyle carries $2.9B net accrued performance revenues on $1.2B FRE; KKR reports $10.2B gross unrealised performance income. High accrued carry can mean future DE upside, but the market may not capitalise it at the same rate as FRE. Our carried interest guide covers the waterfall that governs when carry crystallises.
Worked Example: Getting Blackstone’s Market Cap Right
A P/FRE multiple is only as good as the market cap you build it on, and the share count is where that goes wrong. Jun 2026 inputs (verified):
- Share count: Blackstone divides its per-share FRE and DE by 1,228.8M DE Shares Outstanding: 748.7M common shares plus 34.5M unvested participating shares plus 445.6M Blackstone Holdings partnership units.
- Market cap: 1,228.8M × $119.80 (10 Jun 2026) = ~$147.2B.
- The trap: use the common count alone (748.7M × $119.80 = ~$89.7B) and the market cap is understated by roughly 40%, manufacturing a phantom discount to every scaled peer.
FRE and DE are firm-wide ($5.7B and $7.1B for FY2025), so the cap must be too. The check takes ten seconds: multiply the filer’s own per-share measure by the share count you intend to use, and see whether you get back the filed firm-wide figure. Blackstone’s FY2025 FRE per share of $4.67 times 1,228.8M reproduces $5,739M against filed FRE of $5,737.5M. If your reconstruction misses by 40%, you have the wrong denominator.
Then read any P/DE against the P/FRE as an earnings-mix statistic, not a valuation signal: because both divide the same cap, their ratio is just FRE ÷ DE.
Screening With P/FRE
Start with P/FRE on FY2025 FRE and current market cap (the filer’s per-share FRE/DE denominator × price, not GAAP common counts or vendor aggregates). Place the name in a convention band using perpetual mix and strategy breadth, not AUM alone. Where DE is filed, run P/DE too and read it as a mix statistic: a P/DE above P/FRE simply means DE came in below FRE. Where the label is a proxy (TOE, ANI, After-tax Realized Income) there is no clean DE comparison to make at all.
For firm-level detail and FRE margins, see our Apollo, Carlyle Group, and Blackstone profiles.
What Matters Most
Alternative managers are not valued on a generic earnings multiple. P/FRE on the recurring fee engine is the starting point, and perpetual mix, insurance integration and carry accrual explain most of the low-teens-to-low-thirties spread across the large managers. The habit that saves you from the worst errors is checking that the numerator and the denominator cover the same company: the right share count, and an FRE that actually belongs to the business the market is pricing.
Alternative Asset Managers Primer
The P/FRE bands place a manager without valuing it. The primer builds one from fee-paying AUM to a per-share value.
The Excel model is the primer's two worked valuations live across 12 sheets: change fee-paying AUM, FRE margin or the fundraising rate and the valuation moves. It holds two company slots, one per worked case, not a full peer table.
Frequently Asked Questions
- What multiple do alternative asset managers trade on?
- Equity research primarily uses price-to-fee-related earnings (P/FRE): market cap divided by last-twelve-months FRE, with market cap computed on the share count the filer divides its per-share FRE/DE by, not the GAAP common count. The multiple spans a wide range across the large managers, from the low teens to the low thirties, and the spread reflects perpetual-capital mix and insurance integration rather than one manager being cheap against another. Where distributable earnings are filed, P/DE is worth running alongside, but the two multiples share a numerator, so their ratio only restates FRE divided by DE and is not a read on how the market prices carry.
- What P/FRE is normal for a large alternative manager?
- Desk convention bands: diversified mid-scale 12–18×; scaled multi-strategy 18–25×; mega-cap perpetual or insurance-augmented 25–35×. Third-party M&A comps cite roughly 10–15× for mono-line managers and 25×+ for diversified platforms. The bands describe fee-engine durability, not which name is a bargain.
- Why do alternative managers trade at such different P/FRE multiples?
- Perpetual-capital mix and insurance integration, more than any cheap-versus-dear judgement. A manager with most of its fee-generating AUM in perpetual vehicles re-raises far less of its fee stream than a drawdown-heavy peer, so the market pays more for that durability. Insurance integration adds a second effect: where a manager's market cap capitalises an insurance spread business whose earnings sit outside the FRE denominator, its P/FRE is a whole-firm price over a part-firm earnings figure and looks higher for that reason alone. Net accrued carry, which the fee multiple does not price either way, is a third factor the headline number hides.
- How do you cross-check P/FRE with P/DE?
- Where DE is filed, run both and read the gap as an earnings-mix statistic. Because the same market cap sits on top of both, P/DE divided by P/FRE is exactly FRE divided by DE. If a manager's FRE is 80% of its DE, its P/DE prints below its P/FRE by that ratio, with realisations net of tax making up the rest; where DE comes in below FRE, the P/DE prints above the P/FRE. Neither ratio tells you what the market pays for carry; only a sum-of-the-parts does that.