P/TBV vs ROTCE: How Banks Are Actually Valued
Why large US banks trade on price-to-tangible book paired with return on tangible common equity, with verified Jun 2026 comp points and house valuation bands.
Educational analysis for professional use. This guide is not investment advice or a recommendation to buy or sell any security, and it is not personalised.
Banks Are Priced on Tangible Book, Not a Generic P/E
Equity analysts do not value JPMorgan Chase the way they value an industrial. The starting question is how much sustainable return the franchise earns on tangible common equity, and what multiple of tangible book the market will pay for that return. Price-to-tangible book (P/TBV) paired with return on tangible common equity (ROTCE) is the standard lens.
Goodwill from decades of acquisitions sits on the balance sheet but does not absorb credit losses. Tangible book strips it out. ROTCE divides net income available to common shareholders by average tangible common equity. The two metrics move together: higher sustainable ROTCE supports a higher P/TBV, subject to capital headroom and franchise durability.
ROTCE is therefore not ROE, and the gap is not a rounding. Taking goodwill and intangibles out of the denominator makes it smaller, so ROTCE is always the higher of the two, and it is highest above ROE at the banks that have paid the most for acquisitions. A serial acquirer can post a flattering ROTCE while earning an ordinary return on the money its shareholders actually put in. Use ROTCE against P/TBV, since both sides then exclude the same goodwill, but glance at ROE to see what the acquisitions cost.
The Steady-State Identity
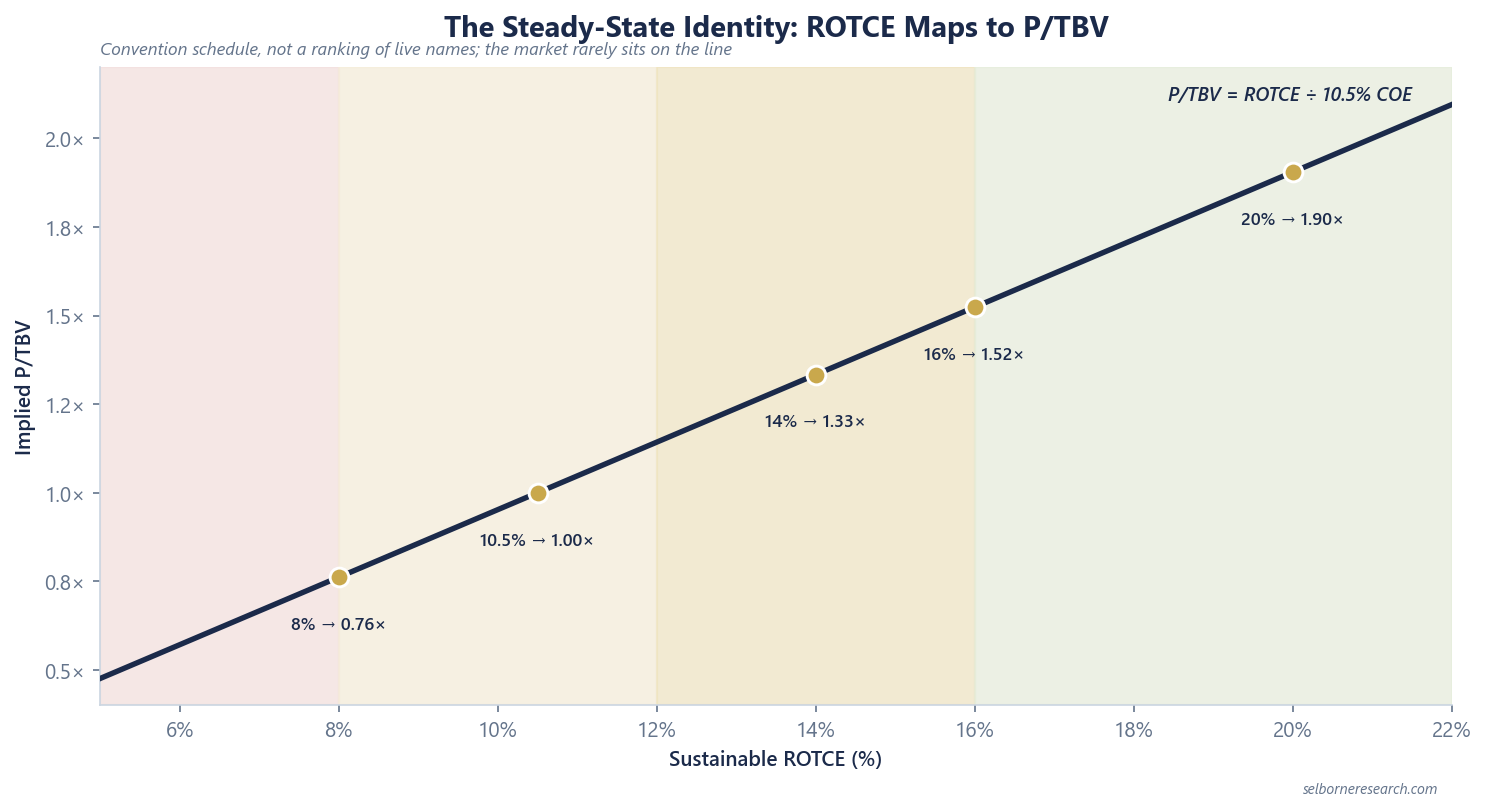
In a simplified steady state, the market capitalises sustainable ROTCE at the cost of tangible common equity (COE):
P/TBV ≈ ROTCE ÷ COE
This is an illustrative check, not a precise fair-value formula. Franchise quality, rate sensitivity, credit cycle position, and capital return capacity all pull the multiple away from the line. Read as a convention schedule rather than a ranking of live names, the identity maps a sustainable return onto an implied multiple:
| Sustainable ROTCE | Implied P/TBV at 10.5% COE (ROTCE ÷ COE) |
|---|---|
| 8% | ~0.76× |
| 10.5% (= COE) | ~1.00× |
| 14% | ~1.33× |
| 16% | ~1.52× |
| 20% | ~1.90× |
The market rarely sits on the line. A durable franchise with diversified earnings, fortress capital and a through-cycle record trades above the multiple its current return implies, because the identity prices one year and the market prices the franchise. A bank earning below its cost of equity can still trade above tangible book where restructuring optionality and a capital build are priced in, even though the steady-state line alone would imply a discount.
Screening Bands: Sustainable ROTCE to P/TBV
These bands are screening thresholds we state for comparison.
| Sustainable ROTCE | Typical P/TBV band | What sits here |
|---|---|---|
| <8% | Discount below ~0.9× | Sub-cost-of-equity returns, unless restructuring optionality lifts the multiple |
| 8–12% | ~0.9–1.3× | Sub-franchise returns around tangible book |
| 12–16% | ~1.3–1.8× | Solid franchises earning above their cost of equity |
| >16% | ~1.8× and up, quality above ~2.0× | Money-centre-quality returns, the strongest franchises at the ceiling |
The bands are not tight fair-value ranges. They are screening frames: when P/TBV and ROTCE sit in different bands, ask why. Is the market pricing a turnaround, penalising credit risk, or rewarding capital return capacity?
What 1 pp of Return Buys
The identity gives you the exchange rate directly. Divide by a 10.5% cost of equity and one percentage point of sustainable ROTCE is worth 0.095× of tangible book, near enough a tenth of a turn. A bank whose returns improve from 14% to 16% should, on that arithmetic alone, re-rate by about 0.19×: from 1.33× toward 1.52×.
The word doing the work is sustainable. Markets pay for the return they expect the bank to earn through a cycle, not the one it printed last year, so a good quarter buys nothing until it looks repeatable. Which is why banks in the middle of a turnaround re-rate long before their reported returns arrive, and why banks at the top of a credit cycle often do not re-rate at all.
Worked Example: Steady-State Check
Take a simplified large bank with tangible common equity of $50bn and 1bn shares (TBVPS $50.00). Assume sustainable ROTCE of 15.0%, which generates $7.50 per share to common ($7.5bn ÷ 1bn shares). That is a money-centre-quality return, in the middle of the mid-teens-to-high-teens range large US banks earned in FY2025.
Using a COE anchor of 10.5%:
P/TBV = 15.0% ÷ 10.5% ≈ 1.43× → implied price ≈ $71.43 per share
The result lands inside the range of multiples large US banks trade at. It is not a target price; it is arithmetic showing how ROTCE and COE map to tangible book.
What Moves the Multiple Away from the Line
P/TBV is not just a function of current ROTCE. Capital headroom, cost discipline, and cycle position all pull the multiple away from the steady-state line.
A bank with thin CET1 buffer cannot return capital aggressively; the market may cap the multiple even at decent returns. See our CET1 and bank capital ratios guide for the requirement stack and buffer screen.
Buybacks cut both ways here, and the direction surprises people. Retiring shares above tangible book lowers tangible book per share, because the bank pays more than book for everything it buys. A bank repurchasing at 2.9× tangible book spends $2.90 of cash to retire $1.00 of tangible book. What it gets is the same earnings divided across fewer shares, so EPS and ROTCE both rise. The trade is worth making when the shares are cheap against what the franchise is worth rather than against its book. Only a bank trading below tangible book adds to book per share by buying its own stock.
Efficiency ratio separates banks earning similar spreads on different cost bases. JPMorgan’s 52% overhead ratio versus Wells Fargo’s 66% efficiency ratio (both FY2025) shows why returns and multiples diverge even among money-centre peers. Our efficiency ratio guide covers the definition and comp ladder.
Credit losses compress ROTCE before they compress book value. Markets often anticipate the cycle, pricing P/TBV on normalised returns rather than trailing ROTCE alone.
Using P/TBV and ROTCE Together
Screen in two steps. First, rank the comp set on sustainable ROTCE (normalise for one-offs where disclosed). Second, compare P/TBV to the screening band for that return level and to the steady-state line at your COE assumption.
| If you observe… | Likely interpretation |
|---|---|
| High P/TBV, high ROTCE | Franchise premium; verify capital return capacity |
| High P/TBV, low ROTCE | Turnaround or optionality priced in; returns must catch up |
| Mid P/TBV, mid-high ROTCE | Efficient regionals earning money-centre-like returns |
| Low P/TBV relative to ROTCE | Possible capital constraint, credit concern, or market disagreement on sustainability |
For stock-level context, see our JPMorgan Chase, Citigroup, and US Bancorp profiles.
What Matters Most
P/TBV without ROTCE is meaningless; ROTCE without P/TBV tells you nothing about what you pay for those returns. Across the large US banks the multiple runs from around tangible book on sub-cost-of-equity returns to well over twice book on money-centre-quality ones. The gap is not arbitrary: it reflects franchise quality, capital, and the market’s belief that today’s returns persist.
The steady-state identity reads one year of ROTCE as one multiple. The primer builds ten years of residual income into a justified price-to-tangible-book.
The Excel model is the primer's three residual-income builds live across 12 sheets: change the margin, the credit charge or the cost of equity and the valuation moves.
Frequently Asked Questions
- What is price-to-tangible book value for banks?
- Price-to-tangible book (P/TBV) is share price divided by tangible book value per share. Banks trade on tangible capital because goodwill from past acquisitions does not absorb loan losses. P/TBV is the sector's standard valuation multiple, paired with return on tangible common equity (ROTCE) to judge whether the market is paying a franchise premium or a discount.
- How does ROTCE relate to P/TBV?
- At steady state, P/TBV approximates sustainable ROTCE divided by the cost of tangible common equity (COE). A bank earning 15% ROTCE against a 10.5% COE implies roughly 1.43× tangible book. The market rarely prices this identity exactly, but the ratio explains why a durable high-return franchise commands a larger multiple of tangible book than a bank earning below its cost of equity.
- What P/TBV is normal for a large US bank?
- House bands tie P/TBV to sustainable ROTCE: below 8% ROTCE typically maps to a discount below ~0.9×; 8–12% sits around tangible book; 12–16% runs ~1.3–1.8×; above 16% runs ~1.8× and up, with quality franchises above ~2.0×. Large-cap franchises have recently traded above the steady-state line their return level implies, because the market prices franchise durability the one-year identity cannot.
- Why do bank P/TBV multiples differ from ROE-based valuation?
- ROTCE strips goodwill and other intangibles from the equity base, so it measures return on the capital that actually absorbs loan losses. Because the denominator is smaller, ROTCE is always higher than ROE, and the gap is widest at banks that have paid the most for acquisitions. Pair ROTCE with P/TBV, since both sides then exclude the same goodwill, and read ROE alongside it to see what those acquisitions cost. Academic and central-bank work on bank valuation more often uses ROE against price-to-book; bank analysts use the tangible pair because that is how the stocks are quoted and screened.