CET1 and Bank Capital Ratios
How the US CET1 requirement stack is built from the 4.5% minimum, Stress Capital Buffer and G-SIB surcharge, with verified FY2025 headroom for JPMorgan.
Educational analysis for professional use. This guide is not investment advice or a recommendation to buy or sell any security, and it is not personalised.
CET1 Headroom Is the Distribution Signal
Regulators do not ask whether a bank is “well capitalised” in the abstract. They compare Common Equity Tier 1 (CET1) capital to risk-weighted assets (RWA) against a firm-specific total requirement. The gap between reported CET1 and that requirement is headroom, and headroom is what shareholders care about when judging dividend and buyback capacity.
CET1 is common equity after regulatory deductions (goodwill, certain deferred tax assets, and other adjustments). RWA weights assets by credit, market, and operational risk, so a Treasury bill and a leveraged loan consume very different amounts of the denominator. That has a consequence worth holding on to: a bank can lift its CET1 ratio without raising a dollar of capital, by selling risky assets, hedging exposures or shifting the book into lower-weighted ones. The ratio is simple; the requirement stack underneath it is not.
The Requirement Stack
US large banks face a layered minimum (effective 1 Oct 2025 per Federal Reserve large-bank capital requirements):
| Layer | Rate | Notes |
|---|---|---|
| CET1 minimum | 4.5% of RWA | Basel III floor |
| Stress Capital Buffer (SCB) | Firm-specific; floor 2.5% | Set from CCAR stress test |
| G-SIB surcharge | ≥1.0% if designated | Method 1 vs Method 2; updated annually |
Verified total requirements (effective 1 Oct 2025):
| Bank | Calculation | Total requirement |
|---|---|---|
| JPMorgan Chase | 4.5% + 2.5% SCB + 4.5% G-SIB | 11.5% |
| Citigroup | 4.5% + 3.6% SCB + 3.5% G-SIB | 11.6% |
| Bank of America | 4.5% + 2.5% SCB + 3.0% G-SIB | 10.0% |
| Wells Fargo | 4.5% + 2.5% SCB + 1.5% G-SIB | 8.5% |
Only the 4.5% is a hard minimum. Everything above it is buffer: for banks in the stress-test population the Stress Capital Buffer replaced the old fixed 2.5% capital conservation buffer, and the G-SIB surcharge stacks on top of it. Slipping into that buffer does not close the bank. It caps dividends and buybacks as a share of the bank’s eligible retained income, on a sliding scale that tightens the deeper the shortfall runs. Which is why banks manage to stay clearly above the total requirement rather than above the 4.5% floor.
Verified FY2025 Headroom
End-FY2025 CET1 ratios versus binding total requirements:
| Bank | CET1 (binding approach) | Requirement | Headroom | Buffer screen |
|---|---|---|---|---|
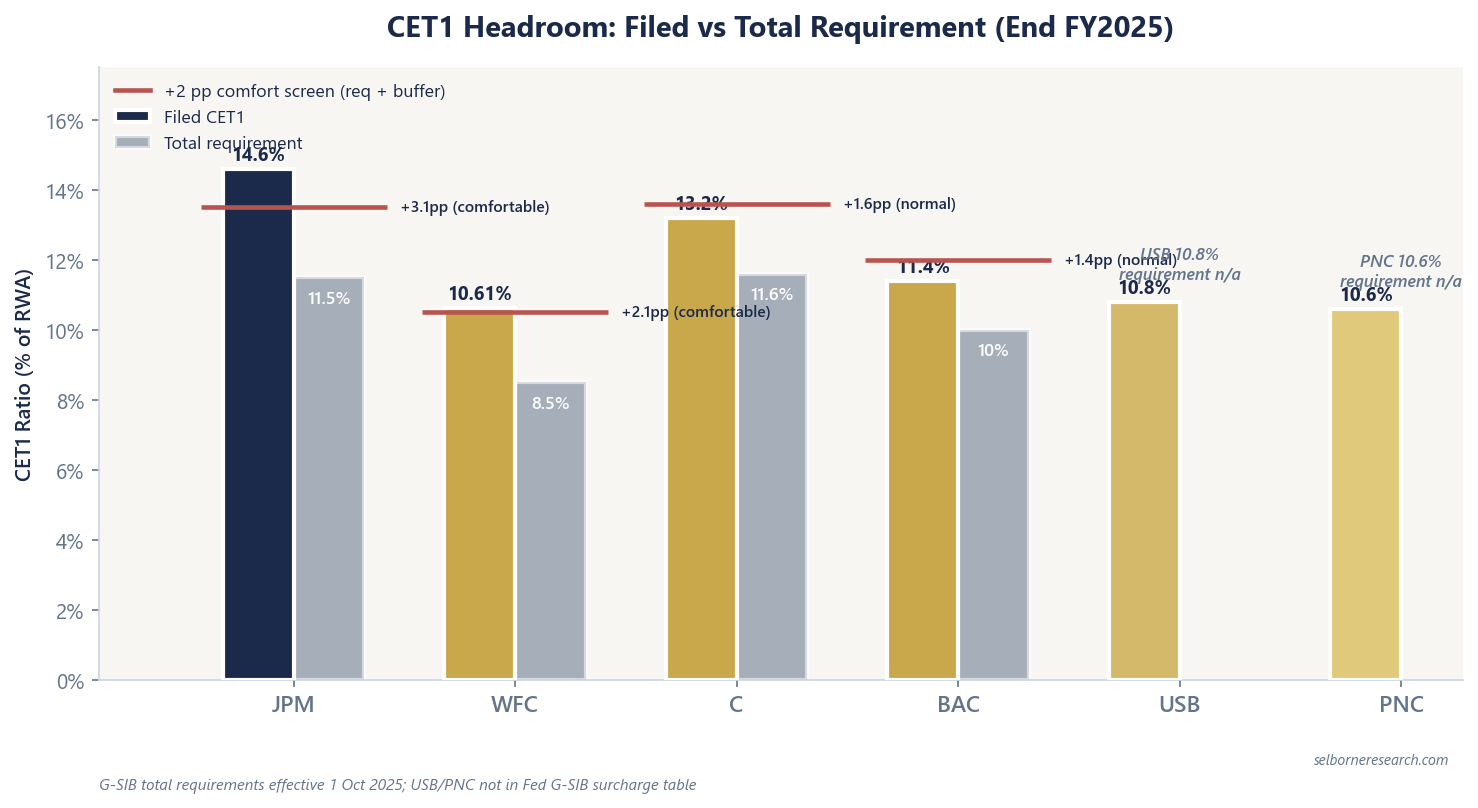
| JPMorgan Chase | 14.1% (Advanced) | 11.5% | +2.6 pp | Comfortable |
| Wells Fargo | 10.61% | 8.5% | +2.1 pp | Comfortable |
| Citigroup | 13.2% | 11.6% | +1.6 pp | Normal (+0.5 to +2.0 pp) |
| Bank of America | 11.4% | 10.0% | +1.4 pp | Normal |
| US Bancorp | 10.8% | 7.1% | +3.7 pp | Comfortable; the widest headroom in the set |
| PNC Financial | 10.6% (estimated at 4Q release) | 7.0% | +3.6 pp (on an estimated ratio) | Comfortable |
JPMorgan’s headline Standardised ratio was 14.6% at year-end, but its Advanced approach ratio was 14.1%, and the lower of the two is the one that binds.
The two super-regionals sit near the bottom of the table on the headline ratio and at the top of it on headroom, because neither pays a G-SIB surcharge and both drew a low stress capital buffer: 4.5% plus 2.6% for US Bancorp, 4.5% plus 2.5% for PNC, effective 1 October 2025. That inversion is the point of the whole table. Bank of America holds a higher CET1 ratio than either and less room above its own requirement, so ranking banks on the headline ratio alone gets the capital question backwards.
House Buffer Screen
| Headroom | Label | Distribution read |
|---|---|---|
| ≥ requirement + 2.0 pp | Comfortable | Room for buybacks and dividend growth through moderate stress |
| +0.5 to 2.0 pp | Normal | Return capacity exists; less margin for error |
| Within +0.5 pp | Tight | Distribution cuts or capital raise risk if losses emerge |
A bank must clear its requirement under both the Standardised and Advanced approaches, and the binding one can switch. At the end of FY2025 Advanced became the binding measure at JPMorgan for the first time in years, so the headroom it can actually spend is +2.6 pp, not the +3.1 pp its Standardised ratio implies. Take the lower of the two.
This is a desk screen, not a regulatory definition. JPMorgan at +2.6 pp and Wells Fargo at +2.1 pp sit in the comfortable band. Bank of America at +1.4 pp and Citigroup at +1.6 pp are normal: adequate, but a bad credit quarter narrows the gap faster.
Credit losses flow through CET1 via retained earnings and RWA. Rising charge-offs compress headroom from both sides. See our net charge-offs guide for the leading indicator.
Worked Example: Capital Walk
Illustrative large bank (primer teaching inputs):
| Input | Value |
|---|---|
| Risk-weighted assets | $500bn |
| CET1 ratio | 11.5% → CET1 capital $57.5bn |
| Total requirement | 10.0% → required CET1 $50.0bn |
| Headroom | +1.5 pp → $7.5bn above requirement |
Annual CET1 ratio walk (basis points on RWA):
| Item | bp impact |
|---|---|
| Net income (retained) | +150 bp |
| Dividends (30% payout) | −45 bp |
| Buybacks | −70 bp |
| Net change | +35 bp per year |
Starting at 11.5% with a 10.0% requirement, the bank adds 35 bp of CET1 ratio per year on this assumption set. Headroom widens from +1.5 pp toward +1.85 pp unless RWA growth or losses intervene. The arithmetic is how desk models connect earnings, payout, and distribution capacity.
Multiply headroom in pp by RWA to get dollar capacity: 1.5 pp × $500bn = $7.5bn of CET1 capital sitting above the requirement.
CET1 and P/TBV
Capital and valuation link through return of capital. Headroom is what permits a buyback, and a buyback spreads the same earnings over fewer shares, lifting EPS and ROTCE. Keep the direction on book value straight, because it runs the other way: a bank repurchasing above tangible book pays more than book for every share it retires, so tangible book per share falls. It buys the higher return on a smaller equity base, not a bigger book. Thin headroom removes the choice altogether, which caps the multiple even at strong ROTCE (see P/TBV vs ROTCE).
For the capital and return figures behind these rows, see the JPMorgan Chase, Bank of America, and Wells Fargo profiles.
What Matters Most
CET1 ratio alone is incomplete without the firm-specific requirement. JPMorgan at 14.1% on its binding approach looks similar to Citigroup at 13.2%, but requirements of 11.5% and 11.6% leave different headroom (+2.6 pp vs +1.6 pp) and different distribution risk. Screen headroom first; then ask whether earnings will build or consume it.
Headroom is a reading taken on one balance-sheet date. The primer rolls CET1 forward ten years in basis points of risk-weighted assets.
The Excel model is the primer's three residual-income builds live across 12 sheets: change the margin, the credit charge or the cost of equity and the valuation moves.
Frequently Asked Questions
- What is CET1 ratio for banks?
- Common Equity Tier 1 (CET1) ratio is CET1 capital divided by risk-weighted assets (RWA). CET1 is the highest-quality regulatory capital: common equity after regulatory deductions. The ratio measures loss-absorbing capacity relative to the riskiness of the balance sheet.
- What is the minimum CET1 requirement for US banks?
- US Basel III sets a 4.5% CET1 minimum, plus a firm-specific Stress Capital Buffer (SCB, floor 2.5%) and a G-SIB surcharge of at least 1.0% for globally systemically important banks. Total requirements are bank-specific: JPMorgan 11.5%, Bank of America 10.0%, Citigroup 11.6%, Wells Fargo 8.5%, effective 1 Oct 2025 per Federal Reserve large-bank capital requirements.
- How much CET1 headroom is enough?
- House screen: comfortable at or above requirement +2.0 pp; normal between +0.5 and +2.0 pp; tight within +0.5 pp of requirement. Verified end-FY2025: JPMorgan +2.6 pp on its binding Advanced ratio, Wells Fargo +2.1 pp (comfortable); Bank of America +1.4 pp and Citigroup +1.6 pp (normal band).
- Why does CET1 matter for bank shareholders?
- Headroom above the total requirement determines capacity for dividends and buybacks without breaching regulatory buffers. Thin headroom forces retention or slower capital return even when ROTCE is strong. The market often caps P/TBV when investors doubt distribution capacity.