Net Charge-Offs and the Credit Cycle
How the net charge-off ratio is defined, the FDIC FY2025 industry benchmark, and the verified comp ladder from PNC 0.23% to Citigroup ~1.27%.
Educational analysis for professional use. This guide is not investment advice or a recommendation to buy or sell any security, and it is not personalised.
NCO Rate Tells You What Credit Losses Already Happened
Net charge-offs (NCOs) are realised credit losses on the loan book: loans written off minus recoveries collected. The net charge-off ratio divides NCOs by average loans. It is a rear-view metric, but in aggregate it reveals where the credit cycle stands and which franchises are carrying outsized loss content.
Provisions (loan-loss provision expense) are the forward-looking cousin. Under CECL (Current Expected Credit Loss), US banks recognise expected losses over the life of loans. Provisions typically lead charge-offs into a downturn and lag them on the way out. This guide covers US GAAP/CECL; IFRS 9 staging is a different framework and is not the US bank reporting lens.
Definition
| Term | Formula / meaning |
|---|---|
| Gross charge-offs | Loans removed from the balance sheet as uncollectible |
| Recoveries | Collections on previously charged-off loans |
| Net charge-offs | Gross charge-offs − recoveries |
| NCO ratio | Net charge-offs ÷ average loans and leases |
FDIC Quarterly Banking Profile data use this definition for insured institutions. Company supplements disclose the ratio or the dollar components; always check whether the denominator is average loans, average loans and leases, or a segment subset.
FY2025 Benchmark and Comp Ladder
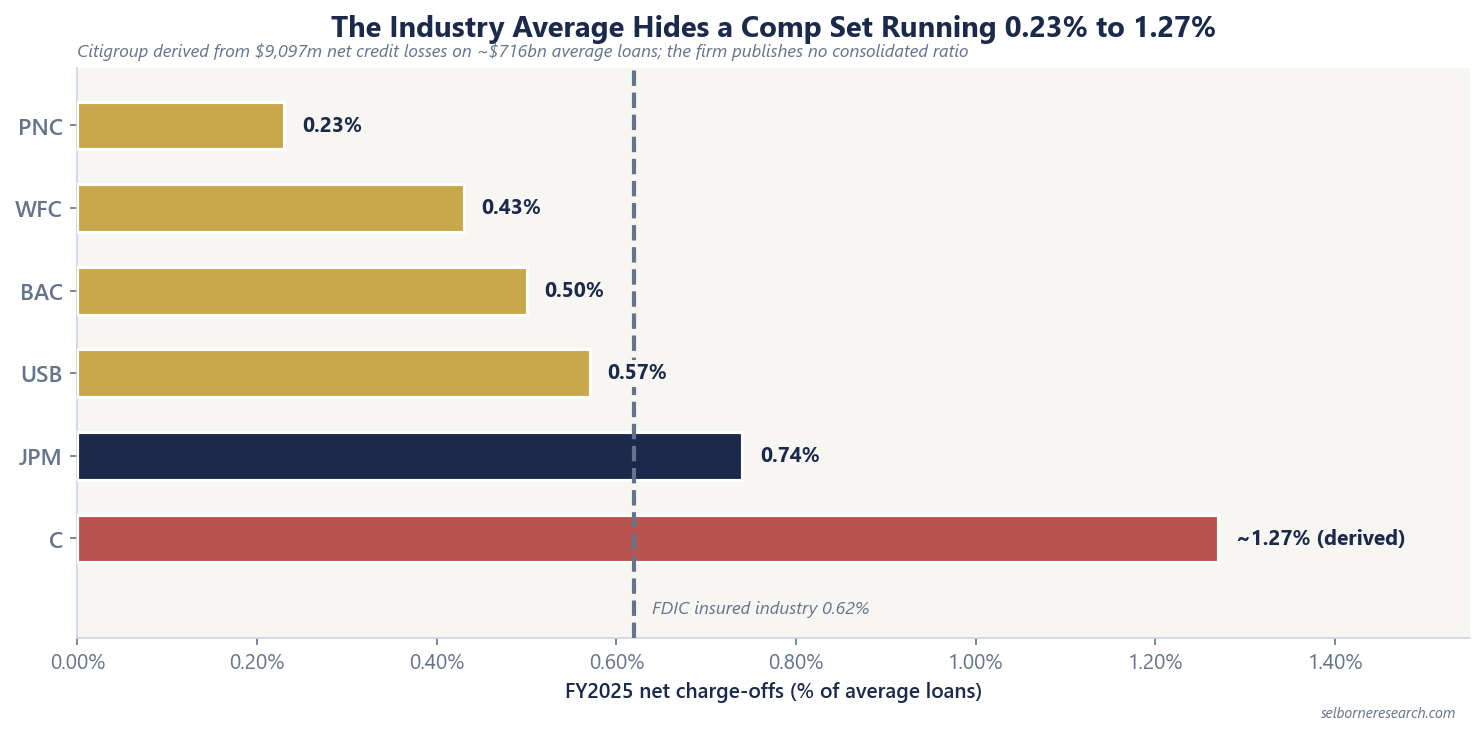
FDIC industry (insured institutions, FY2025): 0.62% of loans and leases. Q4 2025 quarterly rate was 0.63%.
Verified FY2025 comp set:
| Bank | NCO ratio | Source note |
|---|---|---|
| PNC Financial | 0.23% | Lowest in comp set |
| Wells Fargo | 0.43% | |
| Bank of America | 0.50% | $5,631m on average loans and leases |
| US Bancorp | 0.57% | |
| JPMorgan Chase | 0.74% | $9,849m net charge-offs |
| Citigroup | ~1.27% (derived) | Firm publishes dollars, not firmwide % |
Citigroup’s ratio is derived: $9,097m net credit losses ÷ ~$716bn average loans ≈ 1.27%. Citi does not publish a consolidated firmwide NCO percentage; use the derived figure with that caveat.
The comp set spans 0.23% to ~1.27% against an industry 0.62%. PNC sits well below industry; Citigroup sits roughly double industry on the derived measure, consistent with restructuring and card/commercial mix rather than a system-wide crisis in FY2025.
Provisions Lead Charge-Offs
In a benign year, provision expense and NCOs track closely. Entering stress, the sequence is usually:
- Provision builds as CECL models raise lifetime expected losses (macro overlays, downgrade flows).
- Non-performing loans rise before charge-off policy triggers.
- NCO ratio peaks as banks write off previously reserved credits.
Under CECL there are no IFRS-style Stage 1/2/3 buckets in US filings; the economic idea is the same: the income statement absorbs expected losses before the charge-off line catches up.
Watch provision rate minus NCO rate. A widening positive gap often signals the bank is reserving for losses not yet charged off.
The gap runs the other way too, and that is the part to be careful with. The CECL allowance is a management estimate of losses over the life of the book, built on a forecast of the economy, so when the forecast improves the bank releases reserve and the release lands in earnings as a negative provision. Nothing has been collected and no borrower has done anything. A quarter of strong profit growth driven by reserve release is not the same quarter as one driven by revenue, and the two look identical at the net income line. Read the provision line and the charge-off line together, always, and treat a run of releases as a judgement the bank has made rather than a result it has earned.
Links to Capital and Spread
Credit losses hit ROTCE through the income statement and compress CET1 headroom via retained earnings and higher RWA. A bank can report stable NIM while NCOs erode returns.
JPMorgan’s FY2025 NCO ratio of 0.74% exceeded the FDIC industry 0.62%, yet the bank still posted 20% ROTCE; spread and fee income absorbed the credit line. Citigroup’s ~1.27% derived NCO sat alongside 7.7% ROTCE and 64.7% efficiency, so credit was one drag among several, not the whole story.
Worked Example: Deriving Citigroup’s NCO Ratio
Citigroup FY2025 disclosed:
| Item | Amount |
|---|---|
| Net credit losses | $9,097m |
| Average loans (approx.) | ~$716bn |
NCO ratio ≈ $9,097m ÷ $716,000m ≈ 1.27%
Compare to the FDIC industry 0.62%:
1.27% − 0.62% = 0.65 pp above industry
At ~$716bn of average loans, each 1 pp of NCO ratio is roughly $7.16bn of annual net credit losses. Citi’s derived 1.27% implies about $9.1bn of NCL, versus roughly $4.4bn if the bank ran at the industry-average 0.62% on the same loan base. So roughly $4.7bn a year of extra loss is the price of Citi’s mix, most of it card, and it is money that never reaches the ROTCE line.
One caveat on that comparison. The FDIC figure averages every insured institution, thousands of which are community banks with plain lending books, so it is a benchmark for the system rather than a peer for Citigroup. The comp ladder above is the closer read.
The loan base and NCL dollars are from verified filings; the industry comparison uses the FDIC FY2025 benchmark.
Cycle Screening
| Signal | Read |
|---|---|
| NCO ratio rising quarter-on-quarter | Realised losses accelerating |
| Provisions rising faster than NCOs | CECL building buffer for future charge-offs |
| NCO ratio below industry (PNC 0.23%) | Benign book or conservative underwriting; verify CRE/concentration |
| NCO ratio well above industry (C ~1.27%) | Mix, geography, or restructuring; check normalisation path |
Commercial real estate exposure is a common regional-bank watch item; PNC’s 0.23% NCO is the low anchor in the comp set but not a guarantee on forward CRE losses.
For stock-level credit detail, see PNC Financial, Citigroup, and JPMorgan Chase profiles.
What Matters Most
NCO ratio is realised loss content, not expected loss. FY2025 looked benign on an industry 0.62% rate, but the comp ladder already stretched from PNC at 0.23% to Citigroup at ~1.27%. When the cycle turns, CECL provisions move first and charge-offs follow; that gap is the early signal. Check CET1 headroom alongside NCO trends before you bake dividend and buyback capacity through the next credit leg.
A charge-off ratio records one year of a cycle. The primer re-runs each bank's multiple at 1.5 times its own loss rate.
The Excel model is the primer's three residual-income builds live across 12 sheets: change the margin, the credit charge or the cost of equity and the valuation moves.
Frequently Asked Questions
- What are net charge-offs for banks?
- Net charge-offs are gross charge-offs minus recoveries on loans and leases. The net charge-off (NCO) ratio divides net charge-offs by average loans. It measures realised credit loss on the loan book, not expected future losses. The FDIC defines the ratio as charge-offs less recoveries, divided by loans and leases.
- What is a normal net charge-off ratio?
- The FDIC industry average for insured institutions was 0.62% of loans and leases in FY2025 (Q4 quarterly rate 0.63%). Verified FY2025 large-bank comps ranged from PNC at 0.23% to JPMorgan at 0.74%, with Citigroup at approximately 1.27% derived from disclosed net credit losses and average loans.
- Do loan-loss provisions equal net charge-offs?
- Not in a cycle turn. Under CECL, provisions reflect expected credit losses and typically rise before charge-offs peak entering a downturn. In benign periods, provisions and charge-offs converge. Watch the gap between provision expense and NCO rate for early cycle signal.
- How do net charge-offs affect CET1?
- Charge-offs flow through the income statement, reducing retained earnings and therefore CET1 capital. Rising RWA from downgrades can also lift the CET1 requirement. Credit deterioration hits shareholders through both lower earnings and tighter capital headroom.