Net Interest Margin Explained
How net interest margin is defined, why JPM net yield and BAC FTE labels differ from peer NIM, and the FY2025 comp ladder versus the FDIC industry average.
Educational analysis for professional use. This guide is not investment advice or a recommendation to buy or sell any security, and it is not personalised.
NIM Is the Spread on the Balance Sheet
Net interest margin (NIM) answers a simple question: what percentage spread does the bank earn on its earning assets after paying for deposits and other funding? It is the core profitability metric for deposit-funded lenders.
Note the denominator. NIM divides by average earning assets, the loans and securities that actually pay interest, not by total assets and not by revenue. Cash in the vault, premises and goodwill sit outside it. That is why NIM is a spread on a book of assets rather than a profit margin, and why it cannot be read like one.
The FDIC defines NIM as interest earned minus interest paid, divided by average earning assets. No tax adjustment is applied to tax-exempt interest in the industry benchmark. Individual banks may report taxable-equivalent (TE) or fully taxable-equivalent (FTE) variants that gross up tax-exempt income; those are comparable to each other but not always to the raw FDIC aggregate.
The Label Traps
Before comparing two banks, read the footnote. Our FY2025 large-bank comp set uses five different disclosure labels:
| Bank | FY2025 metric | Label in filing | Value |
|---|---|---|---|
| PNC Financial | NIM | Taxable-equivalent (non-GAAP) | 2.83% |
| US Bancorp | NIM | As reported | 2.72% |
| Wells Fargo | NIM | Taxable-equivalent | 2.64% |
| JPMorgan Chase | Net yield | Net yield on interest-earning assets (FTE); firm does not use “NIM” | 2.50% |
| Citigroup | NIM | Taxable-equivalent basis | 2.47% |
| Bank of America | Net interest yield | Net interest yield on earning assets (FTE) | 2.01% |
JPMorgan reports net yield, not NIM. Its consolidated figure blends commercial and consumer banking with markets-related interest income, which pulls the headline yield below deposit-franchise economics. JPMorgan’s ex-Markets net yield was 3.75% in FY2025, a better comparator for spread-focused analysis.
Bank of America reports net interest yield (FTE). The FTE adjustment matters when tax-exempt municipal securities are material.
Citigroup discloses consolidated NIM on a taxable-equivalent basis in the 10-K MD&A interest income table (TE NII $59,898m on average interest-earning assets of $2,426,751m).
Mixing JPMorgan’s consolidated net yield with PNC’s TE NIM without adjustment will rank the wrong bank on spread.
FY2025 Comp Ladder vs Industry
FY2025 large-bank yields span 2.01% (Bank of America) to 2.83% (PNC). The FDIC industry average for insured institutions was 3.30% in FY2025.
| Rank | Bank | Spread metric | FY2025 |
|---|---|---|---|
| 1 | PNC | NIM (TE) | 2.83% |
| 2 | US Bancorp | NIM | 2.72% |
| 3 | Wells Fargo | NIM (TE) | 2.64% |
| 4 | JPMorgan | Net yield (consolidated) | 2.50% |
| 5 | Citigroup | NIM (TE) | 2.47% |
| 6 | Bank of America | Net interest yield (FTE) | 2.01% |
| (benchmark) | FDIC insured industry | NIM | 3.30% |
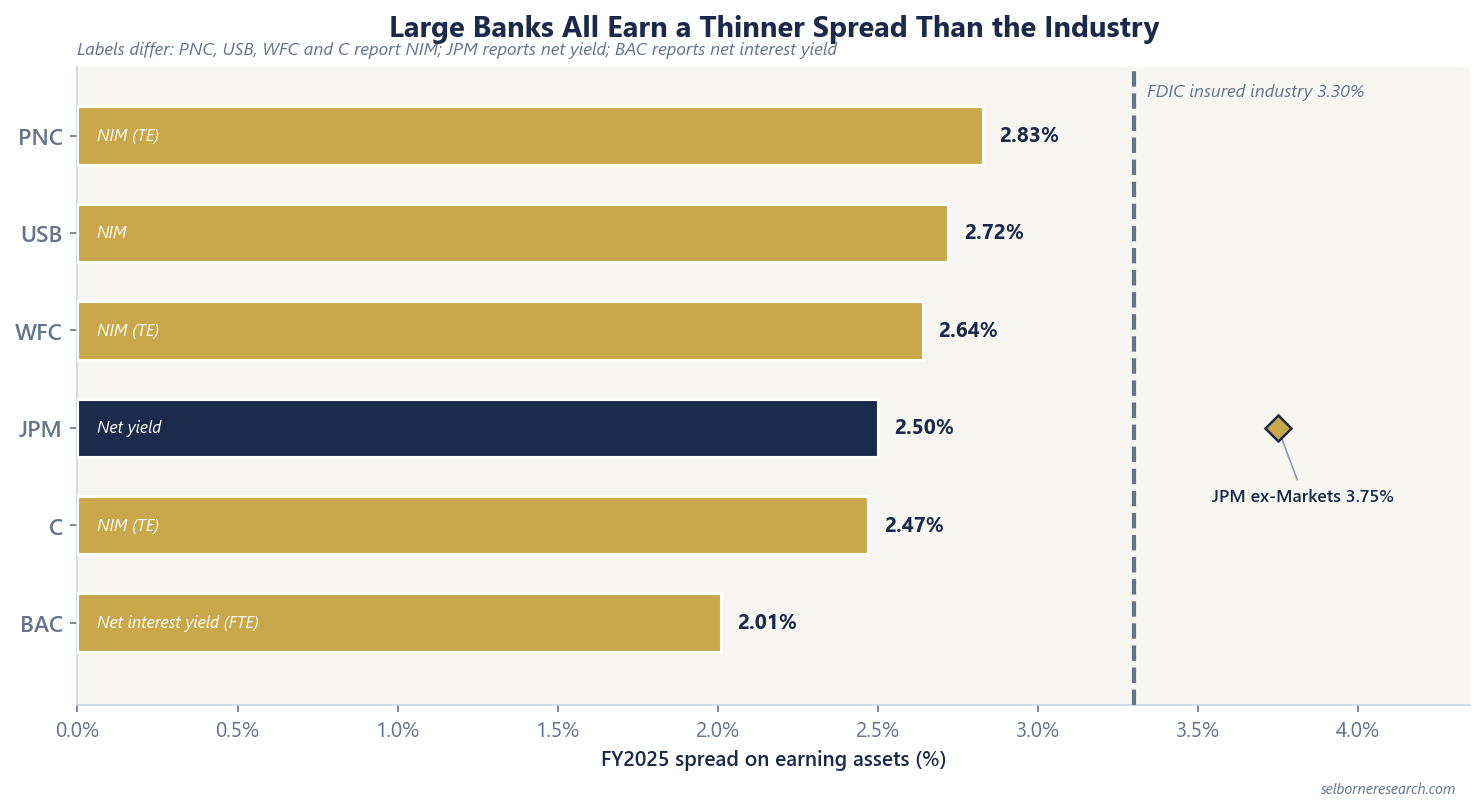
The gap between the comp set and the FDIC average is structural, not a data error. Community banks and smaller regionals often run higher asset yields and simpler business mixes. Money-centre universals consolidate markets, card, and treasury services that dilute the headline NIM. Bank of America’s large, rate-sensitive deposit base also sits at the bottom of the large-bank ladder.
Deposit Beta and Rate Sensitivity
When policy rates move, NIM does not move one-for-one. Deposit beta measures how much of a rate change passes through to deposit pricing:
Deposit beta = Δ deposit rate ÷ Δ policy or market rate
A franchise with high noninterest-bearing (NIB) deposits and low beta keeps more spread when rates fall. A franchise that reprices deposits quickly (high beta) gives spread back to customers.
There is no single authoritative cross-bank FY2025 beta table in public filings; the metric is disclosed in quarterly earnings decks and 10-K MD&A. Compare banks on their own quarterly disclosures rather than a static industry average.
For scenario framing, our planning rate path uses 3.00% Fed funds and 4.50% on the 10-year UST. These are planning marks for sensitivity discussion, not forecasts. A bank with high beta and a large rate-sensitive deposit pool (Bank of America is the teaching case in our comp set) faces more NIM pressure in a falling-rate path than a bank with stickier retail deposits.
Worked Example: Markets Mix Drives the Headline Yield
JPMorgan FY2025 disclosed two net-yield figures in the 10-K:
| Measure | FY2025 |
|---|---|
| Consolidated net yield on interest-earning assets (FTE) | 2.50% |
| Ex-Markets net yield on interest-earning assets | 3.75% |
Gap: 3.75% − 2.50% = 1.25 pp (125 bp)
The consolidated 2.50% net yield blends deposit-franchise spread with markets-related interest income. The 3.75% ex-Markets figure isolates the banking book. Comparing JPMorgan’s consolidated yield to PNC’s 2.83% TE NIM without that adjustment understates JPMorgan’s deposit-franchise spread by more than a percentage point.
Bank of America sits at the other end of the comp ladder: 2.01% net interest yield (FTE) versus the FDIC industry 3.30%, a 129 bp gap driven by funding mix and beta rather than markets dilution alone. See our Bank of America profile for rate-sensitive deposit detail.
NIM and Valuation
Spread drives a large share of bank earnings, but the market prices banks on tangible book and sustainable returns, not NIM alone. A bank can run a wide NIM with poor ROTCE if costs or credit losses absorb the spread.
A rising NIM is not automatically a better bank, either, and this is where the metric misleads most often. Widening spread can come from cheaper funding, which is good, or from lending to riskier borrowers at higher rates, which is a decision to be paid more for taking more credit risk. Subprime card lenders run the widest margins in the industry. So read NIM beside the charge-off rate rather than on its own: if the spread widened and the loss rate widened with it, the bank has changed its risk appetite, not improved its franchise. Then take both to P/TBV vs ROTCE for the valuation frame.
What Matters Most
JPMorgan’s 2.50% consolidated net yield and 3.75% ex-Markets figure belong in the same table as PNC’s 2.83% TE NIM only if you read the footnote. The FY2025 large-bank ladder (2.01% to 2.83%) and the FDIC industry average (3.30%) measure different populations. Deposit beta, filed quarterly, tells you how much of the next rate move the franchise keeps.
A harmonised margin is still a rate on the balance sheet. The primer feeds it through earning assets to net income and ROTCE.
The Excel model is the primer's three residual-income builds live across 12 sheets: change the margin, the credit charge or the cost of equity and the valuation moves.
Frequently Asked Questions
- What is net interest margin for a bank?
- Net interest margin (NIM) is net interest income divided by average earning assets, expressed as a percentage. It measures the spread a bank earns between what it pays on deposits and other funding and what it receives on loans and securities. The FDIC defines it as interest earned minus interest paid, as a percentage of average earning assets, without a tax adjustment for tax-exempt interest.
- Why do bank NIM figures look incomparable?
- Labels differ. JPMorgan reports net yield on interest-earning assets, not NIM. Bank of America reports net interest yield on an FTE basis. Wells Fargo, US Bancorp, PNC, and Citigroup report NIM, often taxable-equivalent. Compare like labels only, and footnote FTE adjustments when present.
- What is a typical NIM for US banks in 2025?
- The FDIC industry average for insured institutions was 3.30% in FY2025, against 3.22% in FY2024. Large diversified banks in our comp set ran lower: Bank of America at 2.01% net interest yield to PNC at 2.83% NIM. Money-centre universals with markets businesses report consolidated yields that understate deposit-franchise spread.
- What is deposit beta and why does it matter for NIM?
- Deposit beta is the change in a bank's deposit rates divided by the change in policy or market rates over a period. A high-beta franchise reprices deposits quickly when rates fall, compressing NIM; a low-beta franchise with sticky noninterest-bearing balances holds spread longer. Banks disclose beta in earnings materials; there is no single cross-bank FY2025 benchmark in filings, so track quarterly disclosures bank by bank.