Distributable Earnings by Firm: ANI, TOE and the Labels
What Apollo ANI, KKR Total Operating Earnings, Ares After-tax Realized Income and Blackstone DE each include, and how to make the labels comparable.
Educational analysis for professional use. This guide is not investment advice or a recommendation to buy or sell any security, and it is not personalised.
The Label Is Not the Metric
Every large listed alternative manager publishes a bottom-line distributable figure. Almost none of them call it the same thing, and none of them build it the same way. Blackstone files distributable earnings. KKR files Total Operating Earnings. Apollo files Adjusted Net Income. Ares files After-tax Realized Income. Carlyle files a pre-tax segment DE with an after-tax number underneath it.
Line those headline figures up in a spreadsheet column and you have produced a ranking of naming conventions, not of earnings power. This is the most expensive rookie error in the sector, and it is entirely avoidable: each filer reconciles its own label, in its own earnings release, usually within two pages of the headline.
The FRE versus DE guide covers why the recurring fee stream and the distributable stream differ in the first place. This page is about the other problem, which is that the second stream has six names.
What Each Filer Actually Files
The FY2025 label map for the six-name comp set. Only two of the six carry a filed “DE” label.
| Company | Filed label | FY2025 | Files “DE”? |
|---|---|---|---|
| Blackstone | Distributable Earnings | $7.1B | Yes |
| Brookfield AM | Distributable Earnings | $2.7B | Yes |
| Apollo | Adjusted Net Income (ANI) | $5.2B | No, renamed from DE in May 2022 |
| KKR | Total Operating Earnings (TOE) | $5.0B | No |
| KKR | Adjusted Net Income (ANI) | $4.4B | No, and not Apollo’s ANI |
| Ares | After-tax Realized Income | $1.7B | No |
| Carlyle | Pre-tax segment DE | $1.7B | Partly, per share is after-tax |
That KKR row is the one to sit with. KKR files an ANI, $4.4B for FY2025, and Apollo files an ANI, $5.2B. Same three letters, different constructions, and a data vendor scraping on label match will happily put them in the same column. A $0.8B gap that looks like earnings power is partly a definitional artefact.
Two Questions Decide Comparability
Every label differs from every other on two axes, and both have to be settled before a number moves into a comp table.
Scope: which earnings streams are inside? Blackstone’s construction is fee-related earnings plus net realisations, and nothing else, with taxes and related payables then taken out. Apollo’s ANI is fee-related earnings plus Spread Related Earnings, the Athene retirement-services engine, plus Principal Investing Income, then interest and taxes. KKR’s TOE is fee-related earnings plus insurance operating earnings plus strategic holdings operating earnings; Global Atlantic sits inside that insurance line. Ares takes a narrower realised-income cut.
So Apollo’s and KKR’s figures carry an insurance balance sheet that Blackstone’s simply does not have. That is a real business difference, but it is a scope difference before it is a performance difference, and it goes in the footnote either way. Our guide on the insurance engine inside alternative managers covers what those spread earnings are.
Basis: where does the tax line sit? This is the axis analysts miss, because a single filing often reports both sides of it.
| Company | Pre-tax | After-tax | Gap |
|---|---|---|---|
| Ares | Realized Income $1,848.3M | After-tax Realized Income $1,704.2M | ~$144M (~8%) |
| Carlyle | Segment DE $1,691.2M | $4.02 per share | Segment table vs per-share line |
Carlyle is the trap in miniature. The segment table gives you $1,691.2M pre-tax; the per-share line gives you $4.02 after-tax. Take the pre-tax figure from the segment table, compare it to a peer’s after-tax label, and Carlyle looks roughly a tax rate more profitable than it is. Nothing in either presentation is wrong; the filer is being explicit. The reader is the one doing the mixing.
The Denominator Moves Too
Once you have a comparable numerator, the per-share base has its own trap, and it is bigger than the tax one.
Filers divide per-share FRE and DE by a broader share count than the GAAP common count, because the earnings themselves are firm-wide. FY2025 bases at each filer’s own reconciliation:
- Blackstone: 1,228,769,322 DE Shares Outstanding, being 748.7M common plus 34.5M unvested participating shares plus 445.6M Blackstone Holdings partnership units
- KKR: 901,075,385 Adjusted Shares, adding exchangeable securities to the common count
- Apollo: 623,502,377 ANI Shares Outstanding, adding the mandatory convertible preferred as-converted plus RSUs; Apollo’s partnership units converted back in 2021
- Ares: 346,239,110 total weighted shares, including Ares Owners LP units exchangeable one-for-one
Blackstone shows the size of the error. Use the 748.7M common count against firm-wide DE and the market cap comes out at roughly $89.7B rather than ~$147.2B (at the 10 Jun 2026 close of $119.80), which manufactures a phantom 40% discount to every scaled peer. The check that catches it takes ten seconds: multiply the filer’s own per-share DE by the share count you intend to use, and see whether you get back the filed firm-wide DE. At Blackstone, FY2025 FRE per share of $4.67 times 1,228.8M reproduces $5,739M against filed FRE of $5,737.5M. If your reconstruction misses by 40%, you have the wrong denominator.
Why the Naive Ranking Fails
Stack the six FY2025 headline figures as filed, unadjusted, and the column reads: Blackstone $7.1B, Apollo $5.2B, KKR $5.0B, Brookfield $2.7B, Carlyle $1.7B, Ares $1.7B.
Read that column and you would conclude Apollo out-earns KKR by $0.2B, and that Carlyle and Ares are twins. Neither holds. Apollo’s figure is after tax and carries Athene spread earnings; KKR’s TOE is a durable-earnings construct spanning insurance and strategic holdings, and KKR’s own ANI is $4.4B, which reorders the pair. Carlyle’s $1.7B is pre-tax and Ares’s $1.7B is after tax, so on a like basis they are not level at all; Ares’s pre-tax Realized Income is $1,848.3M.
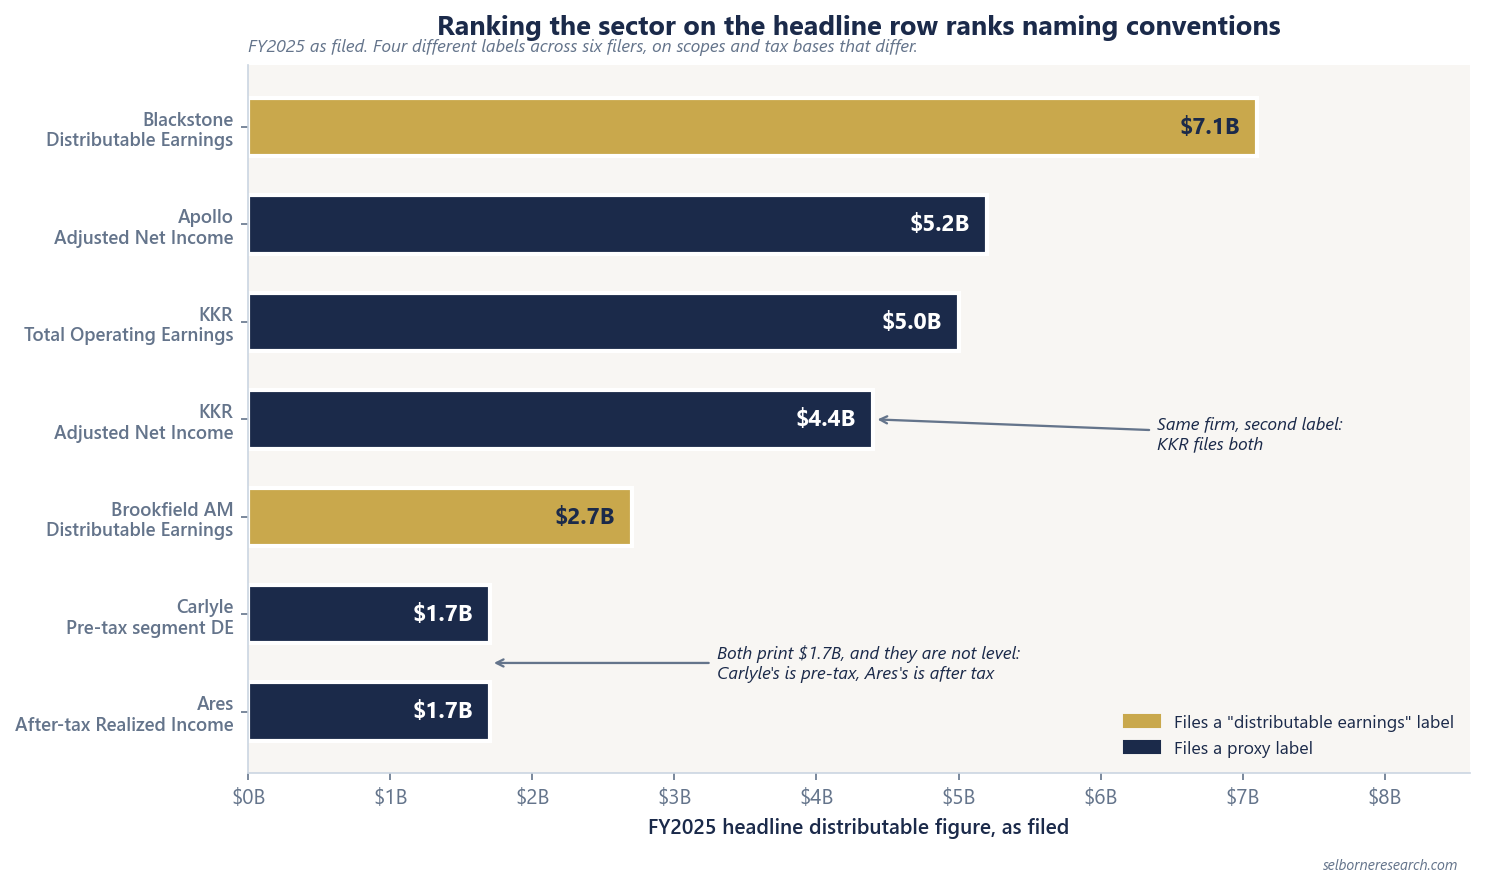
The ranking is not slightly wrong. It is answering a different question from the one you asked, and it will look perfectly plausible in a client deck.
Making Any Filing Comparable
The mechanism is a short procedure, and it survives every label change the sector throws at you. Open the earnings release and work through it in order.
- Find the label. Read the headline non-GAAP measure by name, and do not assume it from the ticker. Labels get retired: Apollo’s DE became ANI in May 2022 with no change to the components.
- Find the reconciliation. Every filer bridges its measure back to GAAP net income. That bridge names the streams inside the number, which settles the scope question without any guesswork on your part.
- Establish the tax basis. Check whether the figure you copied is pre-tax or after-tax, and check it again on the per-share line, which is frequently on the other basis from the segment table.
- Establish the share base. Take the denominator from the filer’s own per-share reconciliation, then verify it: per-share measure times share count should reproduce the filed firm-wide figure.
- Footnote the residual. Where scope genuinely differs, say so in the table rather than adjusting it away. An insurance-inclusive number footnoted as insurance-inclusive is usable; the same number silently ranked against a pure fee-and-realisations number is not.
Steps three and four are cheap and catch the two largest errors. Step two takes longer and is where the real understanding of the business sits.
What This Costs If You Skip It
The pre-tax versus after-tax mix-up moves a name by roughly a tax rate. The share-base error moved Blackstone’s implied market cap by about 40% in our own first pass. This is not a hypothetical failure mode; it is one we made and corrected against the filings. Scope differences can be larger still, because an insurance balance sheet is a whole second earnings engine sitting inside one filer’s headline and absent from another’s.
Two rules cover most of it. Never compare a distributable figure to another firm’s without naming both labels in the footnote, and never build a market cap on a share count you have not reconciled to the filer’s own per-share line. If the primer’s comp table looks tidier than the filings do, someone has adjusted away a difference that was real.
For the multiple that sits on top of these figures, see the valuation guide; firm-level decomposition sits in our Apollo, KKR and Ares Management profiles.
Alternative Asset Managers Primer
Relabelling makes four distributable figures comparable and stops there. The primer sets each against a P/DE cross-check.
The Excel model is the primer's two worked valuations live across 12 sheets: change fee-paying AUM, FRE margin or the fundraising rate and the valuation moves. It holds two company slots, one per worked case, not a full peer table.
Frequently Asked Questions
- What is the difference between adjusted net income and distributable earnings?
- They are labels, not standardised metrics. Apollo reports Adjusted Net Income (ANI) as the successor to the distributable earnings label it retired in May 2022; the components were unchanged, and ANI runs fee-related earnings plus Spread Related Earnings plus Principal Investing Income, after interest and taxes. Blackstone reports distributable earnings as fee-related earnings plus net realisations, less taxes and related payables. Both are bottom-line distributable figures, but they cover different earnings streams and sit on different tax bases, so the labels do not tell you whether two numbers are comparable. Read each filer’s own reconciliation.
- What is KKR Total Operating Earnings?
- Total Operating Earnings (TOE) is KKR’s durable-earnings measure: fee-related earnings plus insurance operating earnings plus strategic holdings operating earnings. FY2025 TOE was $5.0B ($4,985.8M). KKR does not file a distributable earnings label. It separately reports Adjusted Net Income of $4.4B for FY2025, which is a different construction from Apollo’s ANI despite sharing the acronym.
- Is distributable earnings reported before or after tax?
- It varies by filer, and the boundary moves within a single filing. Carlyle’s FY2025 segment table shows pre-tax distributable earnings of $1,691.2M while its per-share figure is after-tax at $4.02. Ares files After-tax Realized Income of $1,704.2M alongside pre-tax Realized Income of $1,848.3M, an 8% spread. Comparing one firm’s pre-tax segment line to another’s after-tax per-share line flatters or penalises a name for nothing but tax presentation.
- Which alternative asset managers actually report distributable earnings?
- In the six-name comp set, only Blackstone and Brookfield Asset Management carry a filed “DE” label: FY2025 DE of $7.1B and $2.7B respectively. KKR files Total Operating Earnings, Apollo files Adjusted Net Income, Ares files After-tax Realized Income, and Carlyle files a pre-tax segment DE with an after-tax per-share number. Four different labels across six filers is why a screen built on the headline row alone ranks the sector wrongly.