Generation Capacity and Technology Mix by Company
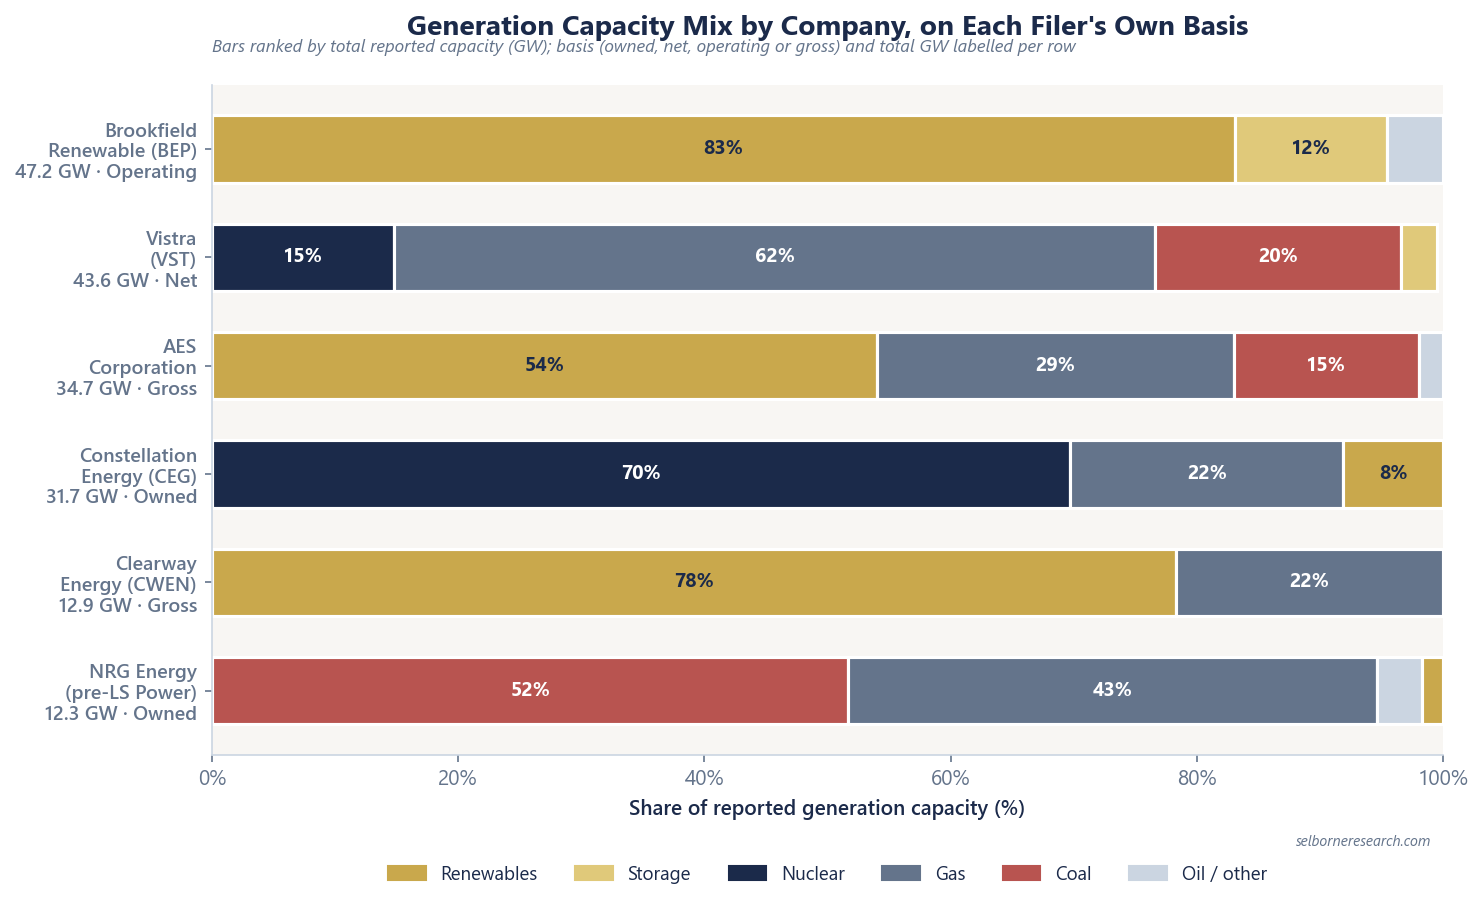
Six power generators ranked by reported capacity in gigawatts, technology mix and each filer's own basis, owned, net, operating or gross, stated per row.
Educational analysis for professional use. This guide is not investment advice or a recommendation to buy or sell any security, and it is not personalised.
A Capacity Ranking Only Holds Together Once You Know Each Filer’s Basis
Generation capacity in gigawatts looks like a single, comparable number. It isn’t. Constellation and NRG report owned capacity: plant they hold title to. Vistra’s basis is net of joint-ownership shares, while AES and Clearway report gross capacity, full plant nameplate before any ownership adjustment. Brookfield Renewable is different again, reporting operating capacity, the megawatts actually in service across its platform. Four conventions, none wrong, all measuring something slightly different.
So the table below carries a basis column alongside the number. Rank six generators on raw gigawatts alone and you are quietly comparing NRG’s pre-acquisition owned fleet against AES’s full gross nameplate as though the two words meant the same thing.
Six Filers Ranked by Reported Capacity
| Rank | Company | Capacity | Basis | Technology mix | As-of |
|---|---|---|---|---|---|
| 1 | Brookfield Renewable (BEP) | 47.2 GW | Operating | Renewables 83.1%, storage 12.3%, balance not itemised by technology | 31 Dec 2025 |
| 2 | Vistra (VST) | 43.6 GW | Net | Gas 61.8%, coal 20.0%, nuclear 14.8%, solar/battery storage 2.9% | 31 Dec 2025 |
| 3 | AES Corporation | 34.7 GW | Gross | Renewables 54%, gas 29%, coal 15%, oil/pet coke 2% | 31 Dec 2025 |
| 4 | Constellation Energy (CEG) | 31.7 GW | Owned (pre-Calpine) | Nuclear 69.7%, gas/oil 22.2% (combined as filed), renewables 8.1% | 31 Dec 2025 |
| 5 | Clearway Energy (CWEN) | 12.9 GW | Gross | Wind/solar/storage 78.3% (not sub-split by the filer), flexible gas 21.7% | 31 Dec 2025 |
| 6 | NRG Energy | 12.3 GW | Owned (pre-LS Power) | Coal 51.7%, gas 42.9%, oil 3.7%, solar 1.7% | 31 Dec 2025 |
Percentages are computed from each company’s own disclosed megawatt figures for the technology categories it reports; they are not always broken out the same way. Clearway discloses 10.1 GW of wind, solar and battery storage as one combined figure rather than three separate numbers, so the chart below carries that segment as a single block instead of splitting it. Brookfield Renewable’s four disclosed technology categories, hydro, wind, solar and distributed generation/storage, sum to about 95% of its 47.2 GW operating total; the remainder is not broken out by technology in the same disclosure.
NRG’s Row Is Its Fleet Before the LS Power Deal
NRG’s row above reflects its owned fleet as filed for FY2025, before the acquisition of LS Power’s generation assets, which completed on 30 January 2026, after the FY2025 year end. On a pro forma basis with that fleet included, NRG’s own materials pointed to roughly 25.8 GW, about 76% gas, a very different fuel mix from the coal-heavy 12.3 GW shown here. The FY2025 figure is the only one directly comparable to the other five companies’ FY2025 filings, so it is what the ranking uses. Anyone modelling NRG after the deal needs the combined fleet instead, on whatever basis the next annual filing reports it.
Capacity Mix Answers a Different Question From Contracted Premium
A technology split tells you what a plant burns or captures. It says nothing about who buys the output, or on what terms, which is a separate axis this sector is valued on. Half the companies in the table above disclose no single contracted-versus-merchant percentage at all. Where a figure is filed, it sits on a different basis again: Brookfield Renewable’s roughly 89% contracted share is measured on 2025 proportionate generation volume rather than on capacity. Clearway’s closest proxy is that about 91% of operating revenue is non-emitting, with a roughly 12-year weighted-average remaining contract life on its renewables and storage book. Constellation’s own forward-looking investor materials split out about 25% of expected baseload clean output under long-term agreements, separately from 72% of its gas and other base gross margin under contract in 2026. None of that is a capacity measure, and none of it belongs in a technology-mix ranking. The PPA versus merchant guide works through how to read each of those disclosures on its own terms.
What Matters Most
Pull the basis before the number when a capacity figure crosses your desk. A 12.3 GW owned fleet, a 12.9 GW gross fleet and a 31.7 GW pre-acquisition owned fleet are not variations on one measurement, they are different questions with different answers. Technology mix tells you what a company generates from. Treat it as a starting point for spark-spread economics on the merchant side and for contract-profile work on the rest.
Renewables & IPPs Sector Primer
Contracted price, contract term and the merchant tail are the inputs. This primer takes them through a multi-period DCF to a value per share, with the spark spread and CAFD bridge for the merchant and yieldco cases.
The Excel model is the primer's two archetype builds live across 10 sheets: a multi-period DCF with a contracted-or-merchant toggle, step-down discount rates for the PPA term and the merchant tail, a spark-spread build for the merchant case and a CAFD-and-payout bridge for the yieldco. Change the realised PPA price, the contracted discount rate or the merchant spread and the value per share moves; the premium and payout sheets update alongside it. It also splits the contracted premium into the part the pipeline explains and the part contract quality explains, splits the PV between contracted years and the merchant tail, and reads EV per kW on both archetypes.
Frequently Asked Questions
- How is generation capacity measured across power companies?
- There is no single filing standard. Owned capacity counts megawatts the company holds title to. Net capacity, Vistra's basis, adjusts for the share of jointly held plant. Gross capacity, used by AES and Clearway, is total plant nameplate before ownership adjustment. Brookfield Renewable reports operating capacity, the MW actually in service. A cross-company ranking has to carry the basis beside the number or it compares different things.
- Which company in this comparison reports the largest generation capacity?
- Brookfield Renewable reports the largest figure at 47.2 GW of operating capacity, ahead of Vistra's 43.6 GW on a net basis. That is an operational fact about fleet size, not a reading of which company is better positioned or more attractively valued.
- Does a company's technology mix show how much of its generation is contracted?
- No. Technology mix (nuclear, gas, renewables and so on) describes what the plant burns or captures, not who buys the output or on what terms. Contract profile is a separate, unevenly disclosed metric: Brookfield Renewable files a contracted share on generation volume, not capacity, and half of the six companies here file no contracted percentage at all.
- Why do NRG Energy's and Vistra's fossil fuel shares look so different from Brookfield Renewable's?
- The two companies run different business models on different fuel. NRG's 12.3 GW pre-acquisition fleet is just over half coal, reflecting a legacy generation and retail business built around Texas. Vistra pairs a majority-gas fleet with nuclear and a large retail book. Brookfield Renewable is a hydro, wind and solar platform by design, so its capacity carries almost no fossil fuel at all. The technology split follows the model each company chose, not a single industry norm.