AFFO for Towers: What It Shows That FFO Misses
Learn why tower REITs rely on AFFO, how it differs from FFO and how to use it for valuation and rate sensitivity.
Educational analysis for professional use. This guide is not investment advice or a recommendation to buy or sell any security, and it is not personalised.
Why Towers Are Read on AFFO
Towers are the one corner of property where AFFO comes close to meaning what it sounds like it means, and that is precisely why it needs handling with care.
Start with the mechanics. FFO strips accounting depreciation out of net income, which is most of what a landlord needs. It leaves in the cash the landlord must keep spending to hold the portfolio in a lettable state, and AFFO is the attempt to put that back. On an office block that bill is enormous: new fit-outs every time a tenant moves, leasing commissions, a building to maintain. On a tower there is barely a building. A galvanised steel structure standing on rented ground costs very little to keep upright, so the deduction is small and AFFO lands within a modest haircut of FFO. That is a fact about the asset type before it is a fact about any one company, and towers sit at the narrow end of the range. Our FFO vs AFFO guide works the wide end of it on an office portfolio.
Now the care. Nareit publishes the FFO definition, which is what makes P/FFO a comparable multiple across the sector. Nareit deliberately did not do the same for AFFO, saying there is no consensus on what the adjustments should be. So AFFO is whatever the company reporting it says it is. The line that moves it most is the split between maintenance capital and growth capital, and that split is management’s own call with no auditor ruling on it. Growth capital never reaches AFFO. A company that classifies generously prints a higher AFFO and a safer-looking dividend with nothing changed on the ground, so a higher AFFO is not automatically a better one. Read the company’s reconciliation before you rank anything on it.
What the Peer Set Looks Like
FY2025 AFFO attributable to common shareholders per diluted share, against prices on 10 June 2026:
| Company | AFFO/sh | Share price | Market cap | P/AFFO |
|---|---|---|---|---|
| SBA Communications (SBAC) | $12.85 | $205.17 | ~$21.8B | ~16.0× |
| American Tower (AMT) | $10.76 | $191.28 | ~$89.2B | ~17.8× |
| Crown Castle (CCI) | $4.36 | $92.30 | ~$40.2B | ~21.2× |
Read the last column, not the first. AFFO per share is total AFFO divided by whatever share count a company happens to have, so its level carries no information: SBA earns the largest AFFO per share of the three and is by some distance the smallest company, because it has around 107 million shares against Crown Castle’s 437 million. The multiple is the part that compares. All three sit inside the tower peer band of roughly 15 to 22 times.
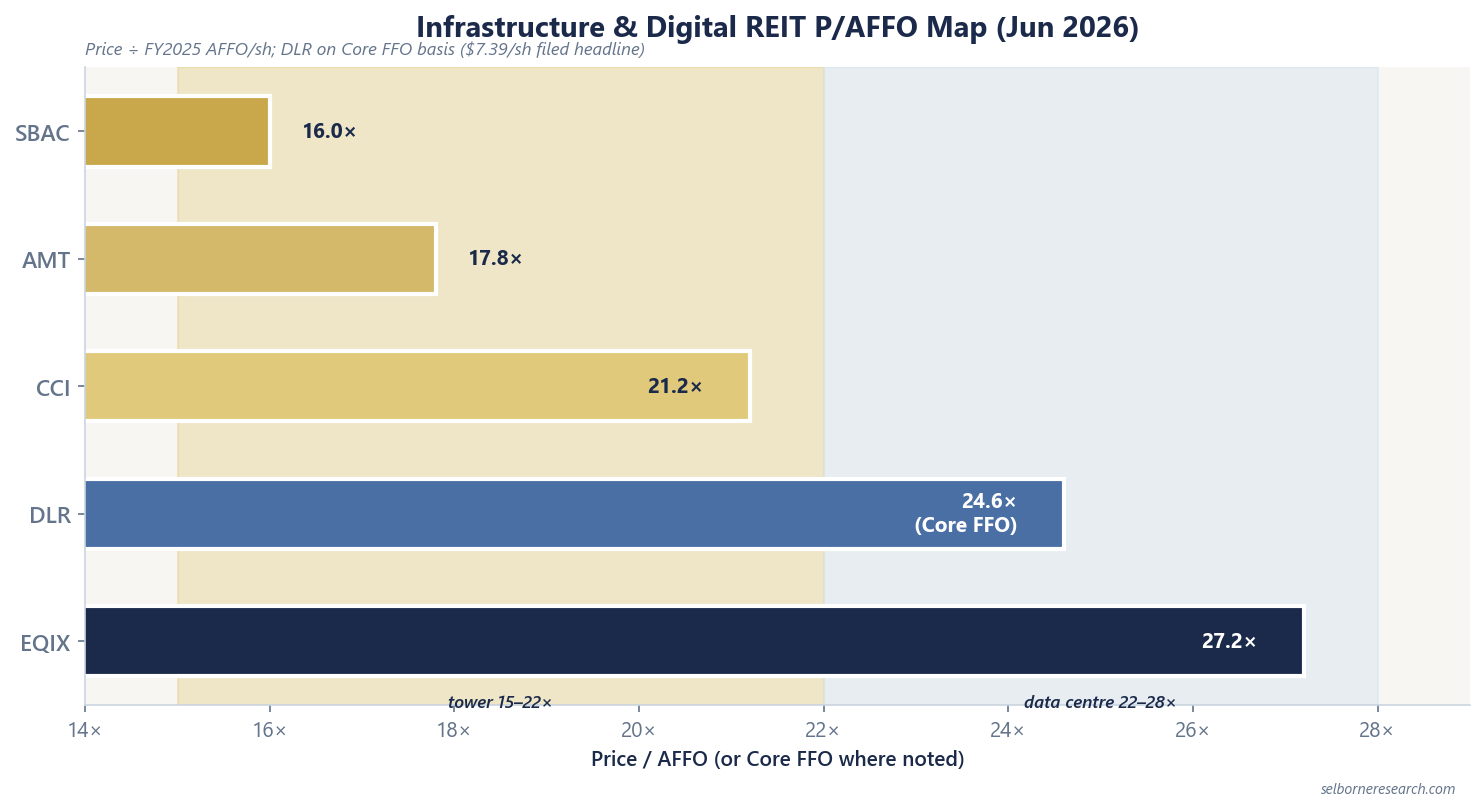
Crown Castle carried the highest multiple of the three in June 2026, having just become a pure US tower company: it closed the sale of its fibre and small-cell businesses on 1 May 2026 for about $8.4 billion net, and began buying back stock and paying down debt with the proceeds. A multiple that reflects an expected balance sheet rather than a reported one is worth treating as unstable.
What Drives AFFO Growth on Towers
Almost all of it is organic, and it comes from rent on towers that already exist. Analysts track it as organic tenant billings growth, or OTBG: the rise in rent from the installed base of sites, before anything bought or built. American Tower reported 5.1% consolidated OTBG in FY2025. Three things make up that number. Contractual escalators lift rent on leases already signed, at roughly 3% a year on typical US leases. Churn takes some back when a tenant leaves. Colocation adds the rest, when a second or third carrier hangs equipment on a tower that is already standing, which is where the economics get interesting: the incremental tenant costs the owner almost nothing to serve, so nearly all of that rent falls through to AFFO. The lease escalators guide walks the arithmetic.
Below that sits the balance sheet. Interest expense is deducted before AFFO, so leverage feeds straight into the number and into how safe it is: American Tower runs net leverage of 4.9×, Crown Castle 5.9× on its covenant definition, and SBA 6.4× net debt to adjusted EBITDA against a stated target band of 6.0 to 7.0×. Tower REITs carry more debt than most equity REITs because the rent is contracted, which is defensible right up until the contract is not renewed.
The Escalator Arrives as Income Before It Arrives as Cash
This is the trap peculiar to towers, and it is worth more attention than the capex line.
A tower lease that steps up 3% a year is not accounted for the way it is paid. Accounting spreads the total contracted rent evenly across the life of the lease, so in the early years the REIT books more rent than the carrier has actually handed over. The difference is called straight-line rent, and it sits in reported revenue and in FFO with no cash behind it. On a long tower lease with a decade of compounding escalators still to run, that gap is not a rounding item.
Which means a tower REIT’s reported revenue growth runs ahead of its cash collection, and it does so structurally rather than as a one-off. AFFO is where the correction happens: reversing straight-line rent is one of the standard deductions from FFO. Two consequences for a reader. Revenue growth is the wrong place to judge a tower REIT, because part of it is a timing convention. And when a portfolio’s escalators eventually mature and the cash rent catches up with the booked rent, AFFO grows faster than the rent roll for reasons that have nothing to do with towers.
P/AFFO Against Data Centre Multiples
Tower multiples cluster around 15 to 22 times. Data centres trade higher, in a band of roughly 22 to 28 times: Equinix at about 27.2 times on FY2025 AFFO of $38.33 a share, Digital Realty at about 24.6 times on Core FFO of $7.39.
Note what just happened in that sentence. Digital Realty’s multiple is struck on Core FFO, its headline earnings measure, not on AFFO, which it files at $6.55. Put it on that filed AFFO and it trades at 27.7 times, marginally above Equinix rather than 2.6 turns below it. Those are not the same units, and a screen that lines them up in one column is comparing two different numbers. That is the general hazard with AFFO multiples: before ranking anything, check that every figure in the column was built the same way.
Even where the units do match, the gap between towers and data centres is not a discount waiting to close. A data centre consumes far more sustaining capital than a tower and grows faster; the two deserve different multiples. Use the REIT screening checklist for cross-sector discipline, and set the thresholds within the peer set rather than across it.
Worked Example: What a Rate Move Does to the Price
Take an illustrative tower REIT earning $10.00 of AFFO per share, valued at 18×, in the middle of the peer band.
Base case: $10.00 × 18 = $180.00 a share.
Long rates rise. Nothing changes at the towers: the leases are the same leases, the escalators still compound, AFFO is still $10.00. But buyers now want a higher yield on that stream, so the multiple compresses to 15×, the floor of the band.
Stressed case: $10.00 × 15 = $150.00 a share.
Change: ($150 − $180) ÷ $180 = −16.7%.
Seventeen per cent of the value gone with the operating business untouched. That is the whole point of the exercise, and it is why long-duration contracted assets do not behave like the bond proxies they are often mistaken for. Neither end of the move is extreme: 18× sits close to where American Tower traded in June 2026, and 15× is inside the range the peer group has actually printed. Leverage stretches it further, because debt-funded companies re-price harder when the cost of that debt moves.
What Can Break the Story
Towers make the cleanest AFFO story in property, and that is exactly the risk: the model looks so durable that people stop asking what would dent it. Three things do.
The tenant list is very short. In any one country a tower REIT’s rent comes from a handful of national carriers. When two of them merge, the combined company inherits two overlapping networks and starts switching off the duplicate sites, so rent that looked contracted disappears at the next renewal. This is not hypothetical. The Sprint and T-Mobile merger produced years of decommissioning, and Crown Castle now reports its churn with Sprint and DISH stripped out precisely because the underlying figure was distorted by it. So read any churn rate alongside what has been excluded from it; our churn guide sets out how differently the three majors define theirs.
The land is usually not theirs. A tower stands on ground the REIT rents from a farmer, a council or a specialist landowner, and that ground rent escalates on its own terms. It is the one significant cost in the structure the tower owner does not set, and it comes up for renewal on a schedule the owner does not control. All three majors have spent years buying the freehold or long easements under their own sites for that reason. A portfolio with a large share of short-dated ground leases carries a cost line that can be repriced against it.
Concentration cuts both ways. The economics of the second and third tenant on a tower are wonderful because the incremental cost is near zero. The same arithmetic in reverse means losing one of them takes almost pure margin out. High incremental margin is not the same as a moat.
None of this makes towers a poor asset. It makes the contracted escalator a floor under normal conditions rather than a guarantee, and it is why the multiple, not the AFFO figure, is where the market expresses its doubt.
Putting a Tower Screen Together
Three checks, in order. Growth in AFFO per share, with the organic layer separated from acquisitions, because bought growth and compounded growth are not worth the same multiple. P/AFFO inside roughly 15 to 22×, compared against the tower peer set only. Net leverage, where the sector’s own norm sits around 5 to 6× and above 7× deserves an explanation.
Then do the thing the screen cannot do for you and open the AFFO reconciliation. You are checking one line: what the company treats as maintenance capital and what it has pushed into growth. Everything above depends on that answer, and it is the only figure in the exercise that nobody outside the company sets. The SBA, American Tower and Crown Castle profiles carry the FY2025 metrics to check a screen against.
Infra & Digital REIT Sector Primer
A tower's AFFO grows on contracted escalators, which a multiple flattens into one number. The primer discounts the AFFO itself.
The Excel model is the primer's two AFFO valuations live across 10 sheets: change the escalators, churn or the 10-year Treasury and the valuation moves.
Frequently Asked Questions
- Why do tower REITs lead with AFFO instead of FFO?
- AFFO (adjusted funds from operations) deducts the recurring cash FFO leaves in: maintenance capital, and the rent booked on paper ahead of the cash. On a tower the maintenance bill is small, because the asset is a steel structure on rented land rather than a power-hungry building, so AFFO lands close to FFO and reads as a fair proxy for what can fund a dividend. The catch is that nobody defines AFFO. Nareit defines FFO and says openly that there is no consensus on the AFFO adjustments, so each company draws its own lines and a higher AFFO is not automatically a better one.
- What were FY2025 AFFO per share for the major tower REITs?
- FY2025 AFFO per share: SBA Communications $12.85, American Tower $10.76, Crown Castle $4.36. Those levels say nothing about quality, because AFFO per share is total AFFO divided by whatever share count the company happens to have. What compares is the multiple. On 10 June 2026 prices, SBAC traded at about 16.0 times AFFO, AMT about 17.8 times and CCI about 21.2 times, all inside the tower peer band of roughly 15 to 22 times.
- How do you screen tower REITs on P/AFFO?
- Divide the share price by AFFO per share, then compare within the tower peer set rather than across property types. On 10 June 2026, SBAC at $205.17 on $12.85 gave about 16.0 times, AMT at $191.28 on $10.76 about 17.8 times, and CCI at $92.30 on $4.36 about 21.2 times. Read each filer's own AFFO reconciliation before ranking, since the deductions are the company's choice. Pair the multiple with leverage (AMT 4.9 times net, CCI 5.9 times on its covenant definition, SBAC 6.4 times net debt to adjusted EBITDA) and with organic billings growth.
- Are tower REITs more rate-sensitive than other equity REITs?
- Towers earn a long, contracted, slowly escalating rent stream, and the further out the cash sits the more a change in the discount rate moves its present value. Leverage magnifies that, and tower REITs run more of it than most equity REITs. So the same AFFO supports a lower price when long rates rise, not because anything has happened to the towers but because buyers demand a higher yield on the same cash.