Industrial vs Office REITs: Key Differences for Investors
Compare industrial and office REITs, from tenant demand and lease structures to valuation, risk and long-term property economics.
Educational analysis for professional use. This guide is not investment advice or a recommendation to buy or sell any security, and it is not personalised.
The Divergence Is About Capital, Not Just Demand
The usual explanation for the industrial-office gap is that people shop online and work from home. That is true and it is not the interesting part, because both shifts were visible years ago and are largely in the price.
What separates the two property types is the cost of keeping a building full. When a warehouse lease expires, the landlord repaints, maybe adds a few dock doors, and signs the next tenant for a few dollars a square foot. When an office lease expires, the landlord funds a fit-out for the incoming tenant: partitions, ceilings, services, finishes. In the US that runs somewhere between $50 and $120 a square foot, plus a broker commission of 4% to 6% of the lease value, plus months of free rent, and it is spent before a single dollar of new rent arrives.
That money leaves the bank account. It does not leave FFO. An office REIT can report growing funds from operations for years while quietly funding fit-outs with borrowed money. Almost everything else on this page follows from that one asymmetry.
Demand: What Actually Drives Each
Industrial: More Space per Dollar of Sales
Industrial real estate means warehouses, fulfilment centres and logistics hubs: the physical layer under the supply chain. Its demand driver is not simply that retail sales grow. It is that an online order consumes more warehouse space per dollar than a shop shelf does, because returns, pick-and-pack labour and next-day promises all need buffer stock held close to the customer.
E-commerce reached 16.9% of US retail sales in the first quarter of 2026, against roughly 5% in 2012 (US Census Bureau). Each percentage point of that shift pulls demand from shop floor to warehouse floor at a multiple of one for one.
Two other threads feed the same demand. Nearshoring moves manufacturing and inventory closer to end markets, which needs domestic industrial capacity. And third-party logistics providers, the contractors that run warehousing and distribution on behalf of retailers, increasingly lease rather than build, which turns an operating decision into a leasing decision.
The counterweight is supply. Warehouses are quick and cheap to build compared with almost any other property type, so a rent spike invites a construction wave. One arrived after 2021 and delivered into 2024, and national industrial vacancy has since drifted up to the mid-to-high single digits from a record low in 2022. Demand kept growing and the market still loosened. Supply constraint in industrial is a matter of land and planning in a few coastal markets, not a national fact.
Office: Demand Came Back, at a Lower Level
Hybrid working reset how much space a company takes per head. That reset happened; it is not still happening. What follows it is a market working through the consequences.
The national office vacancy rate was 18.3% in the second quarter of 2026, down 30 basis points on the quarter, with the ninth consecutive quarter of positive net absorption behind it (CBRE). So office demand is growing again, from a much lower base than 2019, and the vacancy figure is falling rather than rising.
The average conceals the split that matters. Prime space, meaning newer and better-located buildings, was 12.3% vacant against 18.3% for the market as a whole. Tenants that stayed in the market traded up: less space, better building. Older stock in weaker locations did not get that call, and for a good deal of it there is no economic path back to full occupancy, because the rent it can command will not fund the fit-out needed to win a tenant.
If you take one thing from the office section, take that last clause. Office distress is rarely a story about nobody wanting the building. It is a story about the rent not covering the cost of getting someone into it.
Lease Structures: Where the Two Diverge
Industrial: Short Leases, Cheap to Renew
Industrial properties, particularly logistics and fulfilment, tend to be large single-tenant boxes. A 500,000 square foot warehouse is often leased whole to one operator.
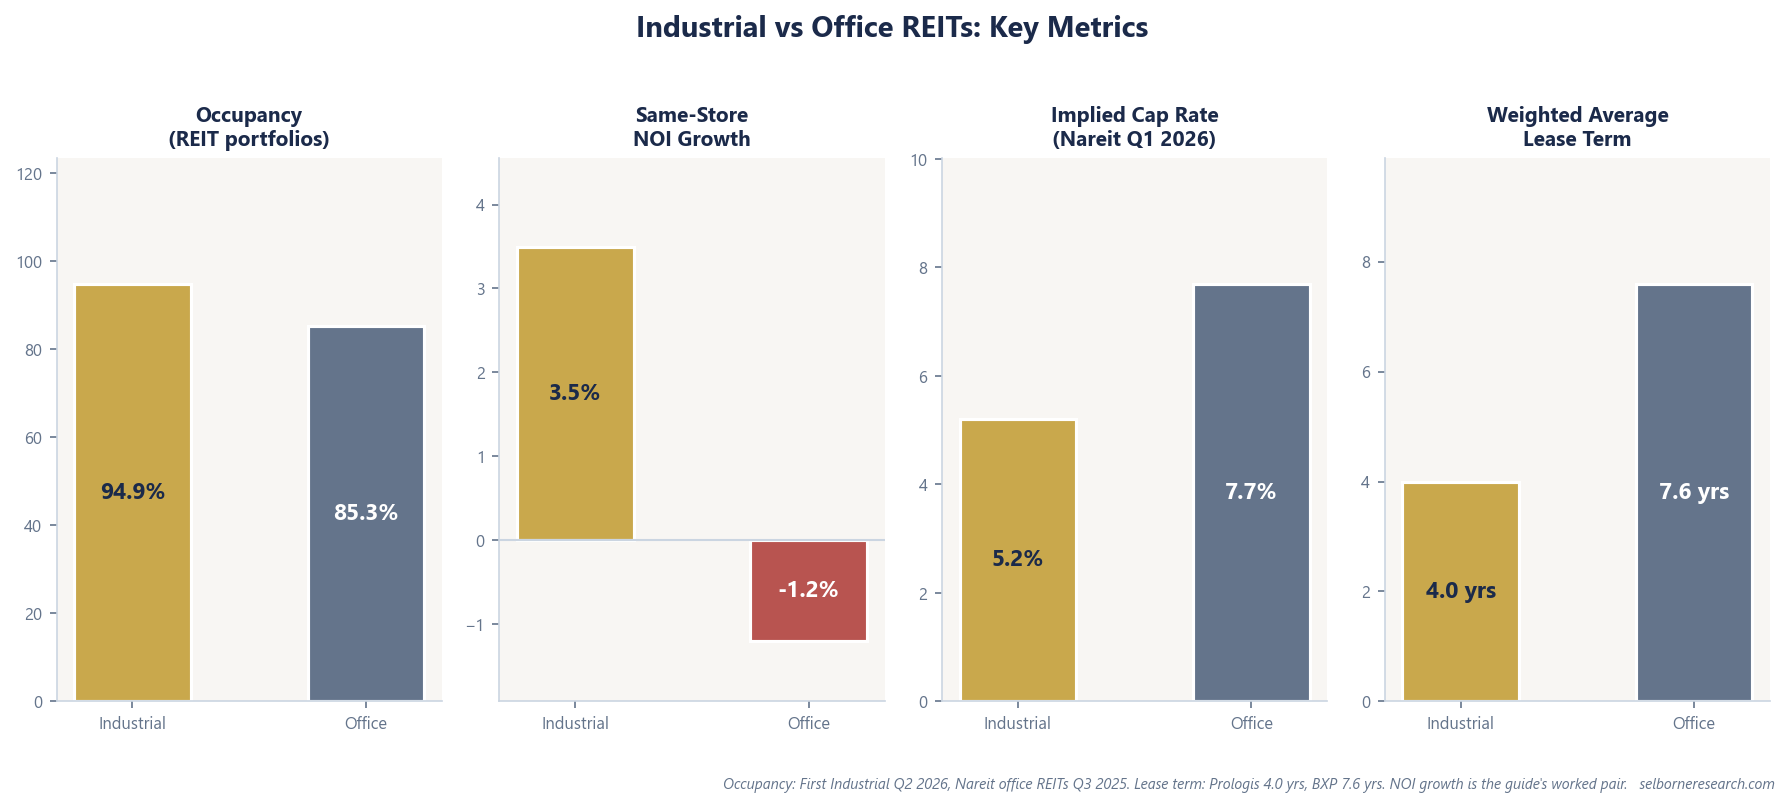
- Length: typically 3 to 7 years. Prologis reported a weighted average remaining lease term of 4.0 years across its owned and managed portfolio at the second quarter of 2026.
- Structure: net or triple-net, so the tenant pays property taxes, insurance and maintenance on top of base rent.
- Rent escalation: 3% to 4% annual step-ups are common in recently signed leases; older leases sit nearer 2% to 3%. Some are indexed to CPI.
- Cost to re-let: tenant improvement allowances of roughly $3 to $15 a square foot, and a commission of 4% to 5% of lease value.
Example. An industrial REIT leases a 400,000 square foot distribution centre at $10 a square foot triple-net, so $4.0 million of annual rent, on an eight-year term. With 3% step-ups the rent in the final year is $4.0m x 1.03⁷, about $4.9 million. If market rents have run ahead of that path, the renewal marks up further still, and the landlord captures the difference for the price of a repaint.
Office: Long Leases, Expensive to Renew
Office is usually multi-tenant, at higher rent per square foot, and on longer terms than most people assume. BXP’s in-place leases had a weighted average remaining term of about 7.6 years at 31 March 2026, and the leases it signed in the second quarter of 2026 averaged 9.9 years.
- Length: typically 7 to 10 years for institutional-quality space, shorter for small suites.
- Structure: gross or modified gross, so the landlord absorbs operating costs and carries the inflation in them.
- Rent escalation: 2% to 3% step-ups, which in a weak market can be given back in free rent at renewal.
- Cost to re-let: tenant improvements of roughly $50 to $120 a square foot, plus commissions of 4% to 6% of lease value, plus a rent-free period.
So the popular framing has it backwards. Office leases are the longer of the two. A long weighted average lease term sounds like safety, and for an office landlord it is mostly a delay: it postpones the day the capital bill arrives without reducing it.
Example. An office REIT owns a 150,000 square foot tower let to several tenants at an average $35 a square foot, so $5.25 million of rent. A technology tenant occupying 35,000 square feet renews into 20,000, leaving 15,000 square feet to re-let. The landlord finds a new tenant at $32 a square foot, so $480,000 of annual rent.
Getting there costs a fit-out at, say, $50 a square foot on 15,000 square feet, which is $750,000, plus a commission of about 5% on a seven-year lease worth $3.36 million, which is another $168,000. Call it $920,000 of cash out to win $480,000 a year of rent. Close to two years of the new rent goes on paying for the new rent, before counting the months the floor sat empty.
The Number That Does Not Appear in FFO
Run that example per square foot per year and the scale becomes obvious. Spread $50 of tenant improvement over a seven-year lease and it is roughly $7 a square foot a year, set against a $32 rent. More than a fifth of the office rent is being handed back as capital. Do the same on the warehouse, at perhaps $8 a square foot over a five-year lease, and it is $1.60 against a $10 rent, around a sixth, on rent that then marks up on renewal rather than down. If anything that flatters office, because the $32 is a gross rent with running costs still to come out of it, while the $10 warehouse rent is triple-net and the tenant pays those costs separately.
Funds from operations does not deduct any of it. FFO adds depreciation back to net income and strips out property sale gains; leasing capital is capitalised on the balance sheet, so it never touches the FFO line. Adjusted FFO does deduct it, which is why the FFO-to-AFFO gap is far wider for office landlords than industrial ones, and why the two property types cannot be compared on P/FFO alone. Our FFO vs AFFO guide works the full bridge.
One consequence worth holding on to: occupancy on its own tells you nothing. A landlord can buy occupancy with free rent and a generous fit-out allowance, and the reported percentage will look identical to occupancy won on price. Net effective rent, which spreads the concessions across the term, is the number that separates the two. Where a REIT discloses net effective rent change on renewals, read that before you read occupancy.
Tenant Credit and Concentration
Industrial: Strong Anchors, a Weaker Tail
The recognisable industrial tenants are creditworthy. Amazon carries an AA rating from S&P. The large global freight forwarders and parcel carriers behind it, the DHLs and FedExes of the tenant roster, are solidly investment grade.
Concentration is usually milder than people expect at the big REITs. Prologis reported its top ten customers at 15.2% of net effective rent in the second quarter of 2026, with Amazon, the largest, at 4.7%. Smaller or single-market industrial REITs concentrate a good deal more, so check the schedule rather than assuming.
The tail is where the credit sits. Below the household names, a large share of warehouse space is leased to contract logistics operators running on thin margins and heavy debt. XPO, one of the larger listed names in that group, is rated in high yield rather than investment grade. Freight recessions hit those tenants first.
Office: Fewer, Larger, More Cyclical
Office concentration can be far higher. Kilroy Realty’s top ten tenants accounted for 54% of annualised base rent, on 38.8% of the space. One departure moves the whole income statement.
The credit is also less exalted than it looks. At holding-company level the big US banks sit in the single-A to BBB+ area at S&P rather than the AA that their brand suggests; the AA-rated entities are usually the operating subsidiaries that do not sign the lease. Below them sit mid-market law firms, regional banks and unrated professional services.
And office tenants are pro-cyclical in a way warehouse tenants are not. In a downturn law firms shrink, banks cut headcount and startups fail, all at the point where the landlord most needs to re-let. A warehouse tenant in the same downturn ships less but does not usually abandon its distribution network.
Lease Expiry: Read It as a Capital Schedule
The expiry schedule is the most useful single page in an office or industrial supplement, and most readers use it wrongly. They look for how much rent is at risk. The better question is what it costs to renew that rent.
Industrial: expiry is an upside event. Short leases mean rents reset often, and after a decade of rent growth they reset upwards. Prologis put its lease mark-to-market at roughly 17% at 30 June 2026, meaning in-place rents sit about that far below market, and reported a net effective rent change of 36.9% on leases signed in the second quarter of 2026. Rolling a lease is how that embedded value gets collected. A short weighted average lease term is an asset here, not a risk.
Office: expiry is a capital event. When an office lease rolls, the landlord faces some combination of downtime, a fit-out, a commission and a renewal rent that may be flat or lower in net effective terms. So the number to compute from an office expiry schedule is not the percentage of rent expiring. It is that percentage multiplied by the square footage behind it multiplied by the landlord’s own disclosed cost per square foot of re-letting. That product, against the REIT’s cash flow and its undrawn credit, is the actual test.
The second test sits next to it: when does the debt mature. Re-leasing capital and refinancing arriving in the same two years is the pattern behind most office REIT distress, because the landlord is asking a lender for money at exactly the moment its rent roll looks least certain.
Valuation Multiples and Cap Rates
A cap rate and an earnings multiple are the same statement inverted. A cap rate divides income by value; a P/FFO multiple divides value by income. So a low cap rate means a high multiple, always. Industrial’s tight cap rates and its high multiples are one fact stated twice, not two pieces of evidence.
Nareit’s Q1 2026 tracker puts the implied cap rate on listed industrial REITs at 5.2% and on listed office REITs at 7.7%: the market is paying about $19 for a dollar of warehouse net operating income, the rent left after property running costs, and about $13 for a dollar of office NOI. Transaction cap rates by property type and market tier are in our cap rates by property type guide.
On multiples, industrial has traded in the high teens to low twenties of forward FFO, with Prologis at the top of that range on 2026 core FFO guidance of a little over $6 a share. Office has traded in the high single digits to low teens; BXP has changed hands around 8x its 2026 FFO guidance of roughly $7 a share.
Why industrial commands it: rents reset upwards on a short cycle, the capital needed to hold occupancy is small, and development still creates value. Why office does not: the rent roll rolls slowly, each roll costs money, and the buyer of the multiple is also buying the fit-out bill behind it.
The trap in both directions is treating the cap rate as a verdict on quality. It is a price. A 5% cap rate says the market expects growth and low capital intensity, and if it is wrong about either you have overpaid for a good building. A 7.7% cap rate says the market expects the opposite, which is a description of consensus, not of the asset.
Same-Store NOI and Development
Same-store net operating income compares the same buildings year on year, stripping out acquisitions and disposals. Industrial REITs have generally run it at 3% to 5%, split roughly between contractual escalators and the mark-up on rolled leases. Office has hovered near zero, with the better gateway portfolios modestly positive and weaker secondary portfolios negative, as rent lost on downsizing renewals offsets escalators and operating cost inflation runs through a gross lease straight to the landlord.
Development tells the same story more starkly, because it is the cleanest test of whether a property type creates value.
Industrial builds at a profit. Prologis stabilised $1.76 billion of development in the first half of 2026 at a weighted average yield of 7.2% and a margin of 27.1%. Building at a 7.2% yield into a market pricing standing industrial assets near a 5.2% cap rate turns a dollar of cost into meaningfully more than a dollar of value. That spread is why industrial REITs keep starting projects.
Office builds at a loss. A new Class A tower might stabilise at a 5.5% to 6.0% yield. The market prices listed office at 7.7%. Spend a dollar, create less than a dollar: the arithmetic runs backwards, which is why almost no speculative office is being started. What office REITs do instead is redevelop, either upgrading an existing building to compete for the flight to quality, or converting it to another use.
Conversion is harder than the headlines suggest, and the constraint is geometry rather than money. Office floorplates are deep, built around a central core, with windows only at the perimeter; flats need light and air on the outside wall. A 150,000 square foot office building typically yields somewhere around 100 to 150 flats rather than the 200-plus a naive division of the floor area suggests, because a large slice of the interior cannot be made into a habitable room. Conversions therefore work in a narrow set of buildings: shallow floorplates, older stock, and a location where residential value per square foot comfortably exceeds office value. Most deep-plate towers do not qualify at any price.
Occupancy: Name the Basis Before You Compare
Occupancy figures for office get quoted in at least three incompatible ways, and much of the confusion in the sector comes from mixing them.
- Listed REIT portfolios. Nareit put office REIT occupancy at 85.3% in the third quarter of 2025, against 93.4% in the fourth quarter of 2019. REITs own better-than-average buildings, so this runs above the market.
- The wider market. National office vacancy was 18.3% in the second quarter of 2026, so roughly 82% occupied, and improving. Non-REIT institutional funds have run several points below the REIT figure.
- Utilisation. Badge-swipe data showing how many desks are used on a given Tuesday. It runs far lower than either of the above and it is not occupancy: a tenant paying rent on an empty floor is 100% occupied and 0% utilised. Never set a utilisation figure against a leased-occupancy figure.
Industrial has none of this ambiguity. REIT portfolios have held in the mid-90s, First Industrial reporting 94.9% in the second quarter of 2026, while the wider market sits a few points below on the back of the recent supply wave.
A Worked Example: Direct Comparison
Two hypothetical REITs, at multiples in the ranges above.
| Industrial REIT A | Office REIT B | |
|---|---|---|
| Share price | $90 | $25 |
| FFO per share | $5.00 | $3.10 |
| P/FFO | 18.0x | 8.1x |
| AFFO per share | $3.50 | $1.60 |
| AFFO as % of FFO | 70% | 52% |
| Dividend | $2.80 | $1.45 |
| AFFO payout | 80% | 91% |
| Same-store NOI growth | +3.5% | -1.2% |
| Net debt / EBITDA | 4.8x | 6.2x |
| NAV per share | $95 (-5%) | $32 (-22%) |
The row that carries the argument is not the multiple. It is AFFO as a percentage of FFO. Industrial A keeps 70 cents of every FFO dollar after capital; Office B keeps 52 cents, because the leasing capital in the earlier example is being spent across its portfolio every year.
Adjust for it and the apparent bargain narrows sharply. On price to AFFO, Industrial A trades at $90 / $3.50, or 25.7x. Office B trades at $25 / $1.60, or 15.6x. The multiple gap on FFO was better than two to one; on AFFO it is closer to 1.6 to 1. Office is still cheaper, and the discount is a good deal less dramatic than the headline suggests.
The rest of Office B’s profile explains why the remaining discount exists rather than removing it. A 91% AFFO payout leaves nothing for a bad leasing year. Leverage at 6.2x means the refinancing and the re-leasing capital compete for the same balance sheet. And a 22% NAV discount says the market doubts the appraised values behind that NAV, which is a reasonable doubt when the appraisals assume re-letting costs the landlord has not yet incurred.
Use the REIT screening checklist to run occupancy, leverage and AFFO payout consistently across a peer set, and our NAV guide to see what those appraised values are built from.
Industrial and office are not a growth story set against a decline story. They are a cheap-to-hold portfolio set against an expensive-to-hold one, and the expense sits below the line most investors read. If you are going to check one thing on an office REIT before anything else, check what it spends per square foot to re-let a floor, and how many square feet it has to re-let in the next two years.
Industrial rents roll up cheaply while office rents roll only after a fit-out. The primer ranks the sector on P/FFO.
The Excel model is the primer's two worked examples live across 13 sheets: change the cap rate, NOI growth or discount rate and the valuation moves.
Frequently Asked Questions
- Why do industrial REITs trade at higher multiples than office REITs?
- Because an industrial lease rolls into a higher rent for almost no money, and an office lease does not. Re-letting a warehouse floor costs a few dollars a square foot; re-letting an office floor costs tens of dollars a square foot in tenant improvements and commissions before any new rent arrives. That capital comes out of cash flow but is not deducted in FFO, so the same reported FFO is worth less at an office landlord and the market pays a lower multiple for it.
- What should you check before buying an office REIT?
- Three things, in order. How much rent expires in the next 24 months, because that is the capital bill coming due. What the landlord actually spends per square foot on tenant improvements and leasing commissions, which sits in the AFFO reconciliation rather than in FFO. And how much debt matures before those leases are re-let, since re-leasing capital and refinancing tend to arrive at the same time.
- How do industrial and office lease structures differ?
- Industrial leases are typically net or triple-net, so the tenant carries most operating costs, and the landlord's fit-out contribution is small. Office leases are usually gross or modified gross, with the landlord absorbing operating costs and funding a build-out for each new tenant. Office leases are also the longer of the two: institutional office runs seven to ten years against roughly three to seven for warehouse space.