Orderbook to Fleet Ratio by Shipping Segment
Orderbook as a share of the fleet for tankers, dry bulk and containers, from BIMCO and Clarksons, each with its measure and date, and what the ratio misses.
Educational analysis for professional use. This guide is not investment advice or a recommendation to buy or sell any security, and it is not personalised.
The Orderbook Is Supply Already Committed
Freight rates are set by how many ships chase how much cargo, and the ship count is the one side of that balance you can see years ahead. A vessel ordered today is delivered years later, so the capacity sitting on shipyard orderbooks is new supply that is already contracted. The orderbook to fleet ratio expresses it as a share of the capacity already trading.
Orderbook to fleet ratio = capacity on order ÷ capacity in the existing fleet
Both sides must be counted in the same unit, and shipping uses four:
- DWT (deadweight tonnes): the weight of cargo, fuel and stores a ship can carry. The usual unit for tankers and bulkers.
- GT (gross tonnes): a measure of a ship’s enclosed volume, not its weight.
- CGT (compensated gross tonnes): gross tonnes weighted for how much shipyard work each ship type takes, so a gas carrier counts for more than a bulker of the same size. Used for the global orderbook across all ship types.
- TEU: twenty-foot container slots, the unit for containerships.
A ratio in one unit is not directly comparable with a ratio in another, which is why every figure below carries its unit.
Four Segments, Two Sources
BIMCO, the international shipping association, publishes quarterly outlooks for each segment. Clarksons Research, the data arm of the shipbroker Clarksons, publishes its own fleet and orderbook statistics. The table gives the latest segment figure found from each source by September 2026, with the unit and the date.
| Segment | Orderbook / fleet | Source | Unit | As-of |
|---|---|---|---|---|
| Containers | 42% (over 14m TEU on order) | BIMCO Container Shipping Market Overview & Outlook | TEU | September 2026 report |
| Containers | 33.9% | Clarksons Research, as quoted in Costamare’s FY2025 annual report | Fleet capacity (TEU) | December 2025 |
| Crude tankers | 28% | BIMCO Tanker Shipping Market Overview & Outlook | DWT | August 2026 report |
| Crude tankers | 17% | Clarksons Research | GT | January 2026 |
| Product tankers | 21% | BIMCO Tanker Shipping Market Overview & Outlook | DWT | August 2026 report |
| Product tankers | 19% | Clarksons Research | GT | January 2026 |
| Dry bulk | 11.4% (121.8m DWT on order) | BIMCO Dry Bulk Shipping Market Overview & Outlook | DWT | End-2025 |
| Dry bulk | 13% | Clarksons Research | GT | January 2026 |
The order is the same on both sources: containers at the top, dry bulk at the bottom. The gaps between the two sources are not the same, and crude tankers show the widest one, 28% against 17%.
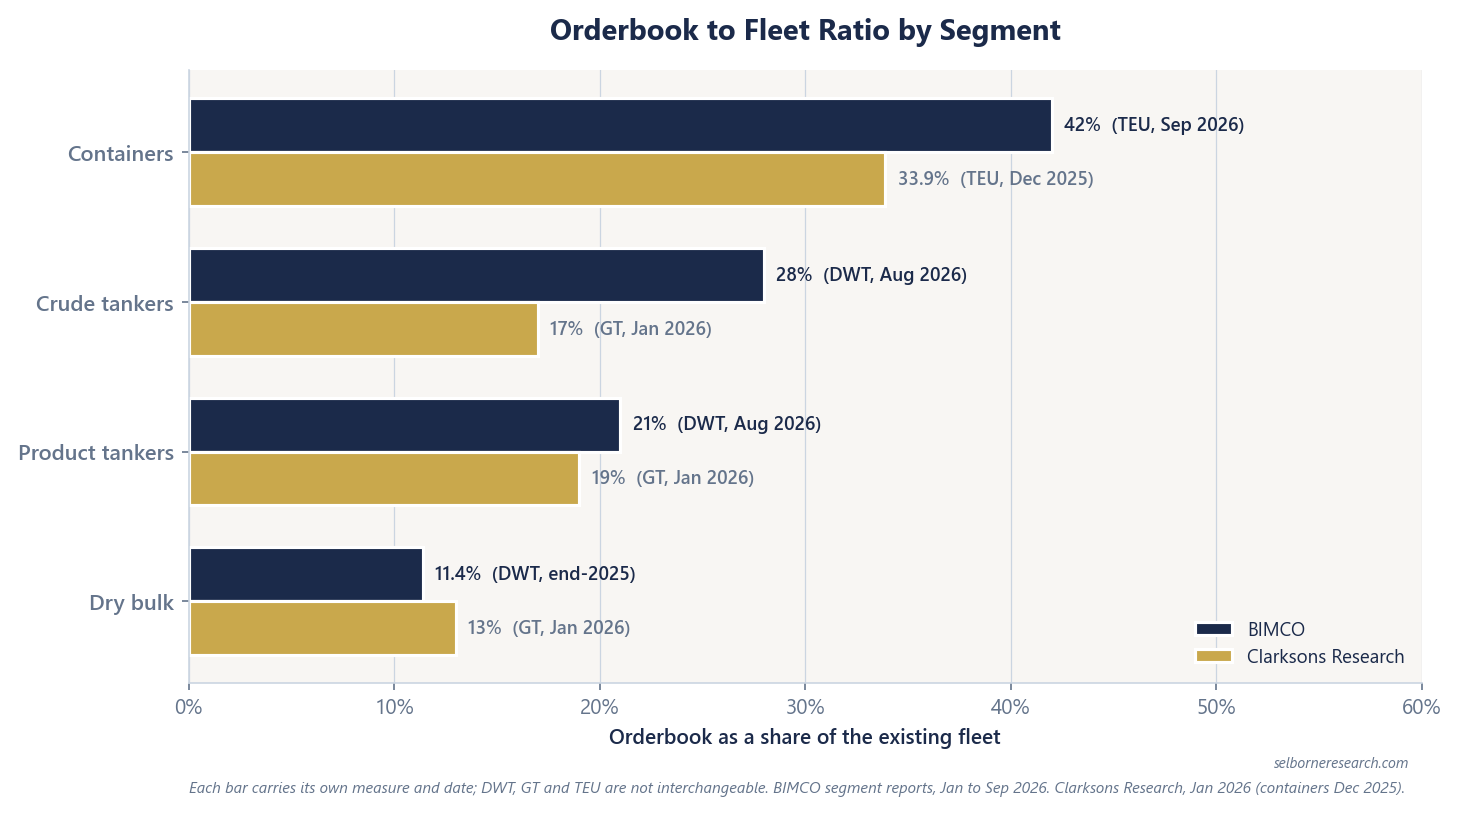
Why One Segment Shows Two Numbers
Three things separate the figures, and the date usually matters most.
The date. An orderbook moves every time a yard signs a contract or delivers a ship, and 2026 moved it fast. BIMCO reported record crude tanker ordering: 60m DWT across 234 ships contracted in 2026 by early July, with Very Large Crude Carriers (VLCCs) making up 71% of the crude capacity on order by its August report. The crude figure climbed with it:
| Crude tanker orderbook / fleet | Source | Unit | As-of |
|---|---|---|---|
| 17% | Clarksons Research | GT | January 2026 |
| 22% | BIMCO | Not stated for segments (the note’s global figure is in CGT) | End of Q1 2026 |
| 27% (130m DWT on order) | BIMCO | DWT | July 2026 note |
| 28% | BIMCO | DWT | August 2026 report |
BIMCO’s product tanker figure rose from 19% to 21% and its container figure from 37% to 42% over the same months. Clarksons’ own mid-2026 review put containerships at 40% and bulkers at 14% of fleet, both above its turn-of-year figures, though the review does not state the unit.
The unit. Weight, volume and slot count do not scale together. When the ships on order are bigger or smaller on average than the ships already trading, the ratio comes out differently in DWT than in GT, even on the same day from the same database.
The segment definition. Clarksons’ mid-2026 review grouped all tankers at 25% rather than splitting crude from product. Container figures hide an even wider spread: Clarksons’ January 2026 figures in GT put the orderbook at 48% of the fleet for ships above 8,000 TEU, 16% for 3,000 to 8,000 TEU and 10% below 3,000 TEU. A single container headline averages size bands with very different orderbooks. The tanker boundary blurs too: LR2s, large product tankers that can also carry crude, made up 52% of the product tanker capacity on order in BIMCO’s August report.
When two sources disagree, show both, with their units and dates. Averaging a DWT figure with a GT figure produces a number neither source published.
What the Ratio Does Not Tell You
A 42% orderbook does not mean a fleet 42% bigger next year. Four things sit between the ratio and the freight market.
Deliveries are spread over years. More than 70% of the crude tanker capacity on order, and more than 50% of the product tanker capacity, is scheduled for delivery in 2028 or later (BIMCO, August 2026). For containers, BIMCO expects 3.2m TEU to be delivered in 2027, with even more scheduled for 2028 and 2029. That is why its forecasts for fleet growth between end-2025 and end-2027 are well short of the orderbook: 13.0% for product tankers against a 21% orderbook, 13.9% for containers against 42%.
Scrapping takes ships out. Net fleet growth is deliveries less demolition, so the useful comparison is the orderbook against the share of the fleet old enough to scrap.
| Segment | Orderbook / fleet | Older tonnage | Recycling constraint | Source |
|---|---|---|---|---|
| Containers | 42% | 16% of capacity is 20 years old or older | Forecast includes 140k TEU of recycling in 2026-27, against 1.6m TEU on ships 25 years or older | BIMCO, September 2026 |
| Crude tankers | 28% | 22% of capacity (106m DWT) is 20 years old or older | Nearly two-thirds of that older capacity is sanctioned, which makes a sale for recycling harder | BIMCO, August 2026 |
| Product tankers | 21% | 19% of capacity (39m DWT) is 20 years old or older | Nearly one-third of that older capacity is sanctioned | BIMCO, August 2026 |
| Dry bulk | 11.4% | Not stated | Recycling forecast at 5.8m DWT in 2026 and 7.7m DWT in 2027, against deliveries above 40m DWT in each year | BIMCO, January 2026 |
Containers carry the largest orderbook and the smallest pool of old ships, so less of the new capacity is offset by demolition. For crude tankers the older pool is large, but sanctions stand between much of it and the breakers.
Speed changes effective supply. A fleet that sails slower carries less cargo per year. BIMCO estimates the container fleet’s capacity-weighted speed fell almost 0.25 knots in 2026 to date, absorbing about one percentage point of fleet growth a year. Speed can work the other way: crude tankers sailed 1.2% faster in 2026 to date than in 2025.
Demand is missing. The ratio is a supply number. The same orderbook can meet a tight or a loose market depending on cargo volumes and sailing distances. BIMCO’s September 2026 report notes that a return to normal Suez Canal routings could lower container ship demand by 10%, because ships would no longer sail the long way round Africa.
From Orderbook to Vessel Values and the Scrap Floor
The orderbook matters for valuation because vessel prices follow expected earnings. A broker’s mark on a second-hand ship, the input to shipping NAV, capitalises the charter income the buyer expects to earn. When deliveries arrive faster than cargo demand grows, time-charter equivalent earnings fall, and second-hand values follow. BIMCO’s September 2026 report expects container freight, charter and second-hand markets to soften in 2027 as deliveries rise, whichever of its two scenarios for the Strait of Hormuz plays out.
Older ships feel it first. Their value sits closest to the steel price, so a fall in earnings pushes them towards demolition value, and demolition is what converts a large orderbook into smaller net growth. Where the old fleet is small, as in containers, or hard to sell for scrap, as in sanctioned tankers, that release is narrower. In a downturn test, the delivery schedule tells you when new capacity arrives; the scrap floor tells you where older ships’ values stop falling.
Reading a Quoted Orderbook Figure
Before using any orderbook percentage, ask four questions: which unit, which date, which definition of the segment, and how much of the fleet is old enough to leave. Then check the delivery schedule. The 28% crude tanker figure and the 42% container figure look alike as headlines, but more than 70% of the crude capacity on order is scheduled for 2028 or later, while container deliveries climb from 2027 against a small pool of old ships.
Time-charter rates, running costs, scrap value and debt are the inputs. This primer takes them vessel by vessel to a fleet net asset value, then stresses it through a freight downturn.
The Excel model is the primer's fleet NAV build live across 11 sheets: each vessel valued on its cash flows over the life it has left plus scrap, fleet NAV to equity for a spot tanker owner and a contracted lessor, an implied-multiple cross-check, a built cash breakeven, a freight-trough scenario and sensitivity grids. Change the charter rate, running costs, fleet age or debt and the NAV moves.
Frequently Asked Questions
- What is the orderbook to fleet ratio in shipping?
- It is the capacity on order at shipyards, contracted but not yet delivered, divided by the capacity already trading, both counted in the same unit: deadweight tonnes (DWT), gross tonnes (GT), compensated gross tonnes (CGT) or container slots (TEU). It shows how much new supply is already committed. It is not next year's fleet growth, because deliveries are spread over several years and scrapping and slower sailing offset part of them.
- Which shipping segment has the largest orderbook relative to its fleet?
- Of the four segments compared here, containers. BIMCO put the container orderbook above 14m TEU, 42% of the existing fleet, in its September 2026 report; Clarksons Research had 33.9% at December 2025. Crude tankers come next at 28% on BIMCO's August 2026 figure. Dry bulk is lowest on both sources: 11.4% at end-2025 (BIMCO, DWT) and 13% in January 2026 (Clarksons, GT).
- Why do BIMCO and Clarksons give different orderbook figures?
- Three reasons: the date, the unit and the segment definition. Crude tankers show all three. Clarksons had 17% of fleet capacity in GT in January 2026. BIMCO had 22% at the end of the first quarter and 28% in its August 2026 report, after record crude tanker ordering in 2026. Clarksons' mid-2026 review also grouped all tankers together at 25%, a different segment again.
- Does a high orderbook mean freight rates and vessel values will fall?
- Not on its own. The ratio measures supply only. What matters for rates is net fleet growth after scrapping and changes in sailing speed, set against demand growth, which the ratio does not show. BIMCO's September 2026 report expects the container fleet to grow 13.9% between end-2025 and end-2027 against a 42% orderbook, and notes that a return to normal Suez Canal routings could lower container ship demand by 10%.