RASM and CASM: Airline Unit Economics
TRASM, PRASM, RASM and CASM-ex defined from carrier filings; the FY2025 US unit-margin comparison; matching revenue to cost; why European metrics differ.
Educational analysis for professional use. This guide is not investment advice or a recommendation to buy or sell any security, and it is not personalised.
Unit Revenue Minus Unit Cost Is the Whole Game
An airline sells seat-miles. Subtract cost per seat-mile, excluding fuel, from revenue per seat-mile and what is left pays for fuel, then interest, tax and shareholders. The fleet is already paid for inside that spread: ex-fuel cost still includes depreciation and aircraft rent.
The trap is mixing definitions. A spread built from a mismatched revenue and cost pair can count revenue without its cost, and Delta’s refinery, below, is the clearest case.
The Alphabet: One Metric Per Column
Each metric divides something by capacity. Carriers differ over what goes on top.
| Term | Numerator | Denominator | Who files it |
|---|---|---|---|
| ASM (available seat mile) | One seat flown one mile, full or empty | Capacity measure | All US carriers (Southwest footnote (c)) |
| RASM / TRASM | Total operating revenue | ASM | Delta, United (TRASM); American, Southwest (RASM) |
| PRASM | Passenger revenue only | ASM | Delta 17.37¢, United 16.18¢, American 16.58¢ (FY2025) |
| CASM | Total operating expenses | ASM | All US carriers |
| CASM-ex / CASM-Ex | Opex ex fuel (and other exclusions) | ASM | Each filer defines exclusions differently |
| PRASK | Passenger revenue | ASK (seat-km) | International Airlines Group (IAG): 8.24 €c/ASK (FY2025) |
| Yield/RPM | Total revenue (fares plus ancillaries) | Revenue passenger miles (one paying passenger flown one mile) | Ryanair: €0.0889/RPM (FY to 31 Mar 2025) |
Delta’s FY2025 GAAP TRASM was 21.26¢ against PRASM of 17.37¢; the gap is cargo, loyalty, refinery and other non-passenger revenue. Sales from Delta’s own oil refinery to third parties were 1.70¢ of it. Delta strips them out to give adjusted TRASM of 19.56¢, and strips the matching cost out of CASM-Ex. American files RASM rather than TRASM, so peer tables need a label column.
European filers use kilometres and euro cents. IAG’s PRASK converts to roughly 13.26 €c/ASM (8.24 €c/ASK × 1.609344). Ryanair’s total revenue works out at roughly €0.0840/ASM. Neither fits the US table without currency and definition work.
CASM-ex Is the Comparable Cost Line
Fuel swings too much for headline cost to compare carriers, so analysts strip it out. Each carrier strips out something different, so read the footnote.
| Carrier | CASM-ex excludes | Headline CASM (FY2025) |
|---|---|---|
| Delta | Fuel, third-party refinery sales, profit sharing and (from March 2026) certain maintenance, repair and overhaul (MRO) items | 19.31¢ |
| United | Fuel, profit sharing, special charges, third-party business expenses | 16.46¢ |
| American | Fuel, net special items | 17.76¢ |
| Southwest | Fuel and oil only; special items and profit sharing stay in | 15.35¢ |
None strips out depreciation or aircraft rent, so every ex-fuel figure on this page still carries the cost of owning and leasing the fleet.
FY2025 Unit Margin, US Carriers (Like-for-Like)
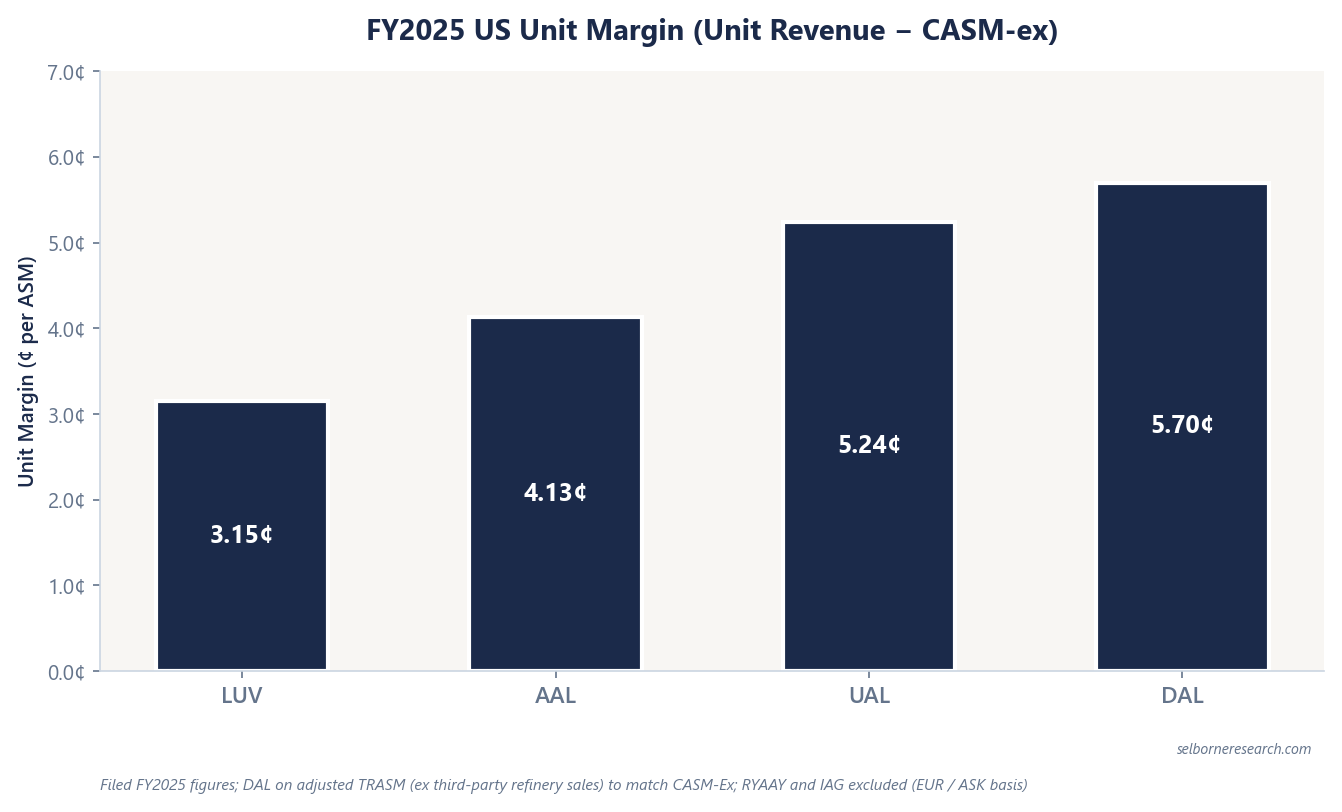
A spread means something only when revenue and cost share a basis. Here that is TRASM (or RASM where TRASM is not filed) minus filed CASM-ex; PRASM never goes in. Delta’s CASM-Ex removes the cost of third-party refinery sales, so it sits against adjusted TRASM, which removes the revenue too. GAAP TRASM would give 7.4¢, counting refinery revenue whose cost has gone.
| Carrier | Unit revenue | CASM-ex | Spread (computed) |
|---|---|---|---|
| Delta | TRASM, adjusted 19.56¢ | CASM-Ex 13.86¢ | ~5.7¢ |
| United | TRASM 17.88¢ | CASM-ex 12.64¢ | ~5.2¢ |
| American | RASM 18.25¢ | CASM ex fuel 14.12¢ | ~4.1¢ |
| Southwest | RASM 15.59¢ | CASM ex-fuel 12.44¢ | ~3.2¢ |
Ryanair and IAG report in other units, so they stay out.
Worked Mini-Example: Spread at a Mid-Network Carrier
Illustrative inputs: 200bn ASMs a year, TRASM 18.0¢, CASM-ex 13.0¢.
| Line | Calculation | Result |
|---|---|---|
| Total revenue | 200bn × 18.0¢ | $36.0B |
| Ex-fuel opex | 200bn × 13.0¢ | $26.0B |
| Unit spread (ex fuel) | 18.0¢ − 13.0¢ | 5.0¢/ASM |
| Spread dollars | 200bn × 5.0¢ | $10.0B |
By convention we screen about 3–8¢/ASM as normal for US network and low-cost carriers. Below about 3¢ little is left for fuel and financing; above about 8¢ usually means a premium revenue mix or unusually low costs. This carrier’s 5.0¢ sits mid-band.
Fuel then takes most of it. At a mid-cycle $2.85/gal and 15 gal per 1,000 ASMs, fuel costs about 4.3¢/ASM (~$8.6B). About 0.7¢/ASM, or ~$1.45B, is left as operating income, because depreciation and aircraft rent sat inside the 13.0¢. The fuel and hedging guide shows the swing.
What to Check Before You Compare
- Revenue basis: TRASM, RASM, PRASM, PRASK or yield per RPM.
- The CASM-ex footnote. Refinery sales, profit sharing and special items differ by filer.
- Currency and distance: euro cents per ASK against US cents per ASM.
- Load factor, the share of seats filled. A wide spread earned while load factor collapses may not repeat; see load factor.
Delta has the widest FY2025 spread once refinery sales are matched out. United runs the largest ASM base, up 6.1% on the year. Ryanair shows the ultra-low-cost model in European units.
EBITDAR builds from a thin unit margin on seat miles, the leases are capitalised into net debt, and the value moves on what a small load-factor drop costs.
The Excel model is the primer's airline build live across 11 sheets: EBITDAR from seat miles and unit margin, leases capitalised into adjusted net debt, a through-cycle EV/EBITDAR valuation for a network carrier and a low-cost carrier, a load-factor downturn, a lease-adjusted leverage screen and a sensitivity grid. Change the unit revenue, fuel or leases and the value moves.
Frequently Asked Questions
- What is RASM in airline accounting?
- RASM (revenue per available seat mile) is total operating revenue divided by available seat miles (ASM). US carriers label it "operating unit revenues" in SEC operating-statistics tables. TRASM is the same ratio on a total-revenue basis; PRASM restricts the numerator to passenger revenue only. European filers often report PRASK (passenger revenue per available seat kilometre) instead.
- What is CASM-ex and why do analysts use it?
- CASM-ex (or CASM-Ex) is operating expense per ASM excluding fuel and other volatile or non-comparable items. Delta's CASM-Ex also excludes third-party refinery sales and profit sharing. It still includes depreciation and aircraft rent. Fuel swings quarter to quarter; ex-fuel CASM is the cost-discipline line you can compare across peers and years once you reconcile each filer's footnotes.
- What is a normal unit margin for US airlines?
- On FY2025 filed data, unit revenue minus CASM-ex ran from ~3.2¢/ASM at Southwest to ~5.7¢/ASM at Delta (Delta on adjusted TRASM, which matches its CASM-Ex). Separately, a common screening convention treats ~3–8¢/ASM as normal for US network and low-cost carriers. Below ~3¢ little is left for fuel and financing; above ~8¢ usually reflects a premium revenue mix or exceptional cost control.
- Can you compare Delta TRASM to Ryanair CASM directly?
- No. Ryanair files CASM in EUR per ASM and yield per revenue passenger mile, not US-style TRASM/PRASM. IAG reports PRASK and CASK in €c per ASK. Cross-border work requires matching revenue and cost definitions, converting currency at stated FX, and converting ASK to ASM with the 1.609344 km factor where needed.