Airline CASM by Carrier: Unit Cost Compared
FY2025 CASM and CASM ex-fuel for six US and European airlines, each on its own definition, unit and year end, and what makes unit cost differ.
Educational analysis for professional use. This guide is not investment advice or a recommendation to buy or sell any security, and it is not personalised.
Each Carrier Decides What “Ex-Fuel” Leaves Out
CASM is operating cost divided by available seat miles: in Southwest’s filed wording, the average cost to fly a seat, empty or full, one mile. That headline figure is defined the same way everywhere. The ex-fuel version is not. Every carrier removes fuel; most then remove a further list of their own: profit sharing at one, special items at another, refinery costs at a third. Two figures both labelled “CASM ex-fuel” can differ by a cent or more for reasons that have nothing to do with how the airlines run.
So the table below carries a basis column: what each carrier’s ex-fuel figure removes, the unit and currency, and the fiscal year end. Four US carriers file in cents per mile for calendar 2025. The two European filers use euros, and one of them counts in kilometres. The metric itself, and how it pairs with unit revenue, is covered in RASM and CASM: Airline Unit Economics.
FY2025 CASM and CASM Ex-Fuel, Six Carriers
| Carrier | CASM | CASM ex-fuel | What the ex-fuel figure removes | Unit and currency | Fiscal year end |
|---|---|---|---|---|---|
| Southwest | 15.35¢ | 12.44¢ | Fuel and oil only; special items and profit sharing stay in | US cents per ASM | 31 Dec 2025 |
| United | 16.46¢ | 12.64¢ (CASM-ex) | Fuel, profit sharing, special charges, third-party business expenses | US cents per ASM | 31 Dec 2025 |
| Delta | 19.31¢ | 13.86¢ (CASM-Ex) | Fuel and related taxes, cost of third-party refinery sales, profit sharing | US cents per ASM | 31 Dec 2025 |
| American | 17.76¢ | 14.12¢ | Fuel and net special items; profit sharing stays in | US cents per ASM | 31 Dec 2025 |
| Ryanair | €0.0746 | ≈€0.0431 (derived) | Fuel only: operating costs of €12,390.5m less fuel of €5,220.2m, divided by 166bn ASMs. Ryanair does not publish an ex-fuel figure | Euros per ASM | 31 Mar 2025 (FY2025) |
| IAG | 8.02 €c (CASK) | 6.01 €c | Fuel costs and emissions charges; before exceptional items (none in 2025) | Euro cents per ASK | 31 Dec 2025 |
The four US rows run in order of ex-fuel figure, lowest first, and that order is exactly what the basis column warns about. Southwest’s 12.44¢ still contains profit sharing and special items, which United and Delta take out. The European rows sit apart because they are in another currency and, for IAG, another distance unit. On a per-mile basis IAG’s figures are about 12.91 €c and 9.67 €c (8.02 and 6.01 multiplied by 1.609344 kilometres to the mile), which is how the chart shows them.
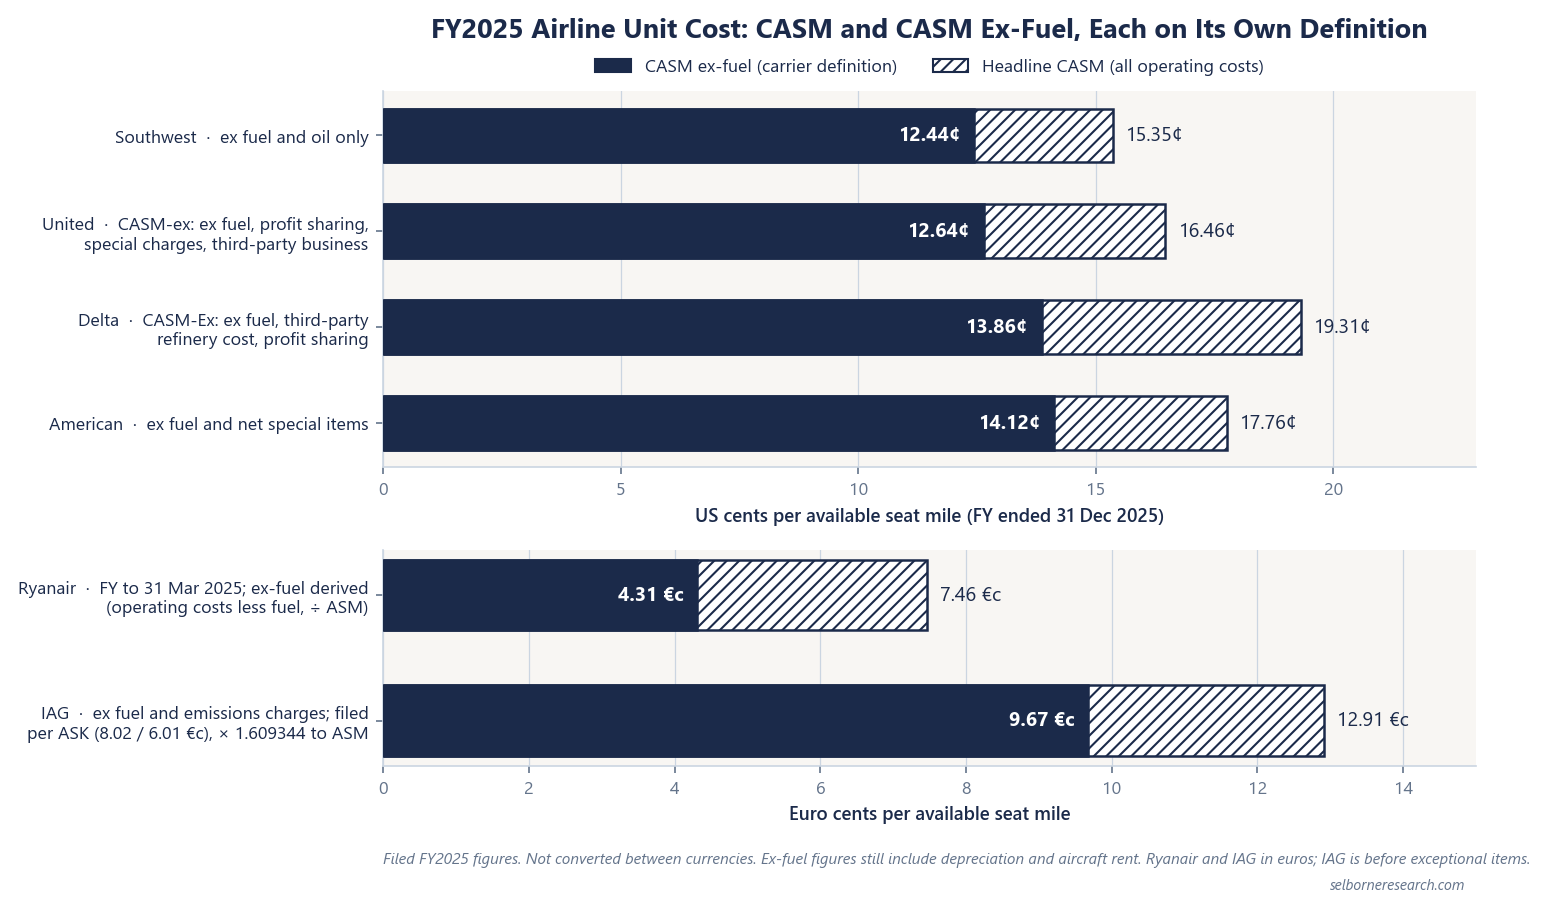
What Each “Ex” Takes Out
Delta is the clearest case, because its reconciliation is itemised. FY2025 CASM of 19.31¢ becomes CASM-Ex of 13.86¢ after removing three things: fuel and related taxes (3.29¢), the cost of refinery sales to third parties (1.70¢) and profit sharing (0.45¢). The refinery line exists because Delta owns a refinery, and fuel it sells to other buyers runs through its income statement. That cost is not the cost of flying, so Delta removes it, and it removes the matching revenue from its adjusted unit revenue too.
Now try to put Delta on Southwest’s basis. Southwest’s 12.44¢ removes fuel and oil and nothing else. Delta’s CASM less fuel alone is 16.02¢ (19.31¢ minus 3.29¢), but that figure still carries 1.70¢ of refinery cost that has nothing to do with running an airline. Neither 13.86¢ nor 16.02¢ is a like-for-like match for Southwest. Getting closer takes each carrier’s reconciliation table and a decision about which items belong in an airline’s cost line. Southwest’s own headline measure, CASM-X, removes special items and profit sharing as well; the 12.44¢ in the table is its fuel-only line, which keeps them in.
The definitions also move over time. Delta’s release now shows a second version of CASM-Ex that also removes MRO expense, the basis it moves to in 2026, so a later Delta figure may not be the same measure as the 13.86¢ here.
One thing none of the six removes is the cost of owning the fleet. Every ex-fuel figure in the table still includes depreciation, and the US figures include operating lease rent. That matters when unit cost feeds a valuation: EBITDAR adds back depreciation and the fixed part of rent, so a cash earnings build has to take both out of CASM ex-fuel first. The EBITDAR and leverage guide covers that step and why leases change the pairing.
The European Rows: Kilometres, Euros and a March Year End
IAG counts capacity in available seat kilometres. A kilometre is shorter than a mile, so cost per seat kilometre is a smaller number for the same cost: multiply by 1.609344 to get cost per seat mile. The conversion is exact, but a converted figure should always say it was converted. IAG’s non-fuel figure removes emissions charges along with fuel, because IAG reports the two as a single cost line; none of the four US reconciliations lists emissions charges.
Ryanair files cost per available seat mile in euros, but for a fiscal year ending 31 March. Its FY2025 ran from April 2024 to March 2025, nine months earlier than the US carriers’ year. Ryanair has since filed its FY2026 annual report for the year to 31 March 2026, which overlaps more of calendar 2025; the figures here are FY2025, the year on our Ryanair profile. Its ex-fuel figure is our own arithmetic from filed totals, which is why the table marks it derived.
Both European filers report under IFRS 16, and that shifts what sits inside unit cost. A US carrier’s operating lease rent is a single operating expense inside CASM. Under IFRS 16 a lease becomes depreciation of a right-of-use asset, which stays in operating costs, plus interest, which sits below operating profit. The interest part of lease cost therefore falls outside IAG’s and Ryanair’s unit cost figures, so, other things equal, a carrier that leases heavily reports a lower unit cost under IFRS 16 than it would under US rules.
We leave the euro figures unconverted. Converting to dollars means choosing an exchange rate on a date, and Ryanair’s year ended nine months before the others; a converted number would look precise while resting on two choices the reader cannot see.
Why Unit Cost Differs Between Carriers
Take the definitions away and real differences remain. Four things drive most of them. Load factor, a fifth candidate, does not enter CASM at all. None of them makes one carrier’s number better than another’s without the revenue side beside it.
Stage length. Much of a flight’s cost comes per departure rather than per mile: landing fees, ground handling, time at the gate. A carrier whose average flight is longer spreads those costs over more seat miles and reports a lower CASM, even if each departure costs the same. United files its average stage length in its operating statistics; check it before comparing a long-haul network with a short-haul one.
Fleet. Southwest runs a single-type fleet and Ryanair flies Boeing 737s. One aircraft type means one set of pilot training, spare parts and maintenance procedures. Network carriers fly several types, from narrowbodies to widebodies, because their routes need them.
Labour. Pay scales, work rules and seniority differ by carrier and by country. Profit sharing is a labour cost that some ex-fuel definitions remove and others keep, so the same year’s labour bill can show up differently in two tables.
Seat density and cabin mix. CASM divides by seats. Fit fewer seats on the same aircraft, for extra legroom or lie-flat premium seats, and the cost of flying it stays broadly the same while the seat count falls, so CASM rises. The premium seats are there to earn more per seat, which is why unit cost read alone says little about a network carrier.
Load factor, which is not in CASM. CASM counts seats flown, filled or not, so a fuller aircraft does not lower it. A higher load factor lowers cost per passenger instead. Ryanair’s 94% load factor in FY2025 changes its cost per passenger, not its cost per seat mile; load factor covers that side.
Fuel is the one cost every ex-fuel figure strips out, and it moves with the oil price rather than with anything the carrier controls in a year. The fuel and hedging guide covers how each carrier handles it.
Unit Cost Is Half a Spread
A unit cost figure answers one question: what it costs this carrier to fly a seat a mile, on this definition. What that cost means depends on what the carrier earns per seat mile, a separate filed number with definitions of its own. Delta’s headline CASM is the highest of the four US carriers, and 1.70¢ of it is refinery cost that Delta’s own ex-fuel measure removes again, with the matching refinery revenue taken out of its adjusted unit revenue. Set cost against revenue on matching definitions before reading anything into where a carrier sits in this table.
Seat miles, unit revenue, unit cost and lease debt are the inputs. This primer builds EBITDAR from a thin unit margin, capitalises the leases and takes it to equity, then shows how a small load-factor drop moves the value.
The Excel model is the primer's airline build live across 11 sheets: EBITDAR from seat miles and unit margin, leases capitalised into adjusted net debt, a through-cycle EV/EBITDAR valuation for a network carrier and a low-cost carrier, a load-factor downturn, a lease-adjusted leverage screen and a sensitivity grid. Change the unit revenue, fuel or leases and the value moves.
Frequently Asked Questions
- How did US airline CASM ex-fuel compare in FY2025?
- On each carrier's own definition, for the year ended 31 December 2025: Southwest 12.44 cents per available seat mile, United 12.64, Delta 13.86 and American 14.12. The four figures remove different costs. Southwest's 12.44 takes out fuel and oil only; United and Delta also remove profit sharing, and Delta removes the cost of refinery sales to third parties. Part of the gap between the rows is definition, not operations.
- Does CASM ex-fuel include depreciation and aircraft rent?
- Yes. Every published ex-fuel CASM for these six carriers still carries depreciation and, for US filers, operating lease rent. To get to a cash earnings measure such as EBITDAR you add both back separately. Under IFRS 16, IAG and Ryanair book leases as depreciation plus interest, so the interest part of lease cost sits below operating profit and outside unit cost.
- Why is Delta CASM-Ex so far below its CASM?
- Delta's FY2025 CASM was 19.31 cents. CASM-Ex of 13.86 cents removes fuel and related taxes (3.29 cents), the cost of refinery sales to third parties (1.70 cents) and profit sharing (0.45 cents), per the reconciliation in its fourth-quarter earnings release. The refinery line is large because Delta owns a refinery whose sales to other buyers run through its income statement.
- How do you compare Ryanair or IAG unit cost with US airlines?
- Keep them in their own units unless you show the conversion. Ryanair files cost per available seat mile in euros for a year ending 31 March. IAG files cost per available seat kilometre in euro cents; multiply by 1.609344 for a per-mile figure. A currency conversion adds an exchange rate on a stated date, and a March year end covers a different twelve months from a December one.