Operating Ratio: the Railroad Efficiency Metric
Operating ratio defined from Class I filings: why lower is better, reported versus adjusted, CSX's margin-derived figure, and turning the ratio into income.
Educational analysis for professional use. This guide is not investment advice or a recommendation to buy or sell any security, and it is not personalised.
Lower OR Means More of Each Revenue Dollar Becomes Operating Income
Operating ratio (OR) is operating expenses divided by operating revenues, so every point of OR is a point of margin the railroad does not keep: margin ≈ 100% − OR. Analysts of the Class I railroads, the largest North American freight carriers, sort on OR first. It folds cost control, network density and pricing into one filed line that compares across peers once reported and adjusted definitions are lined up.
Screening Groups (Not a Filed Benchmark)
For a first sort we group operating ratios below 60%, from 60% to 65%, and above 65%. No Class I 10-K we reviewed uses “sub-60%” as a benchmark, so the bands are our own convention. They say nothing about why a railroad lands where it does: network density, traffic mix and operating history do that work.
FY2025 Operating Ratios, Five Railroads
The two eastern US railroads, Norfolk Southern and CSX, run the highest ratios on either basis. The basis still matters: Canadian National (CN) and Canadian Pacific Kansas City (CPKC) swap places depending on which line you use. The chart shows the reported (GAAP) ratio for all five, with CSX implied from its filed operating margin; the table adds each company’s adjusted line.
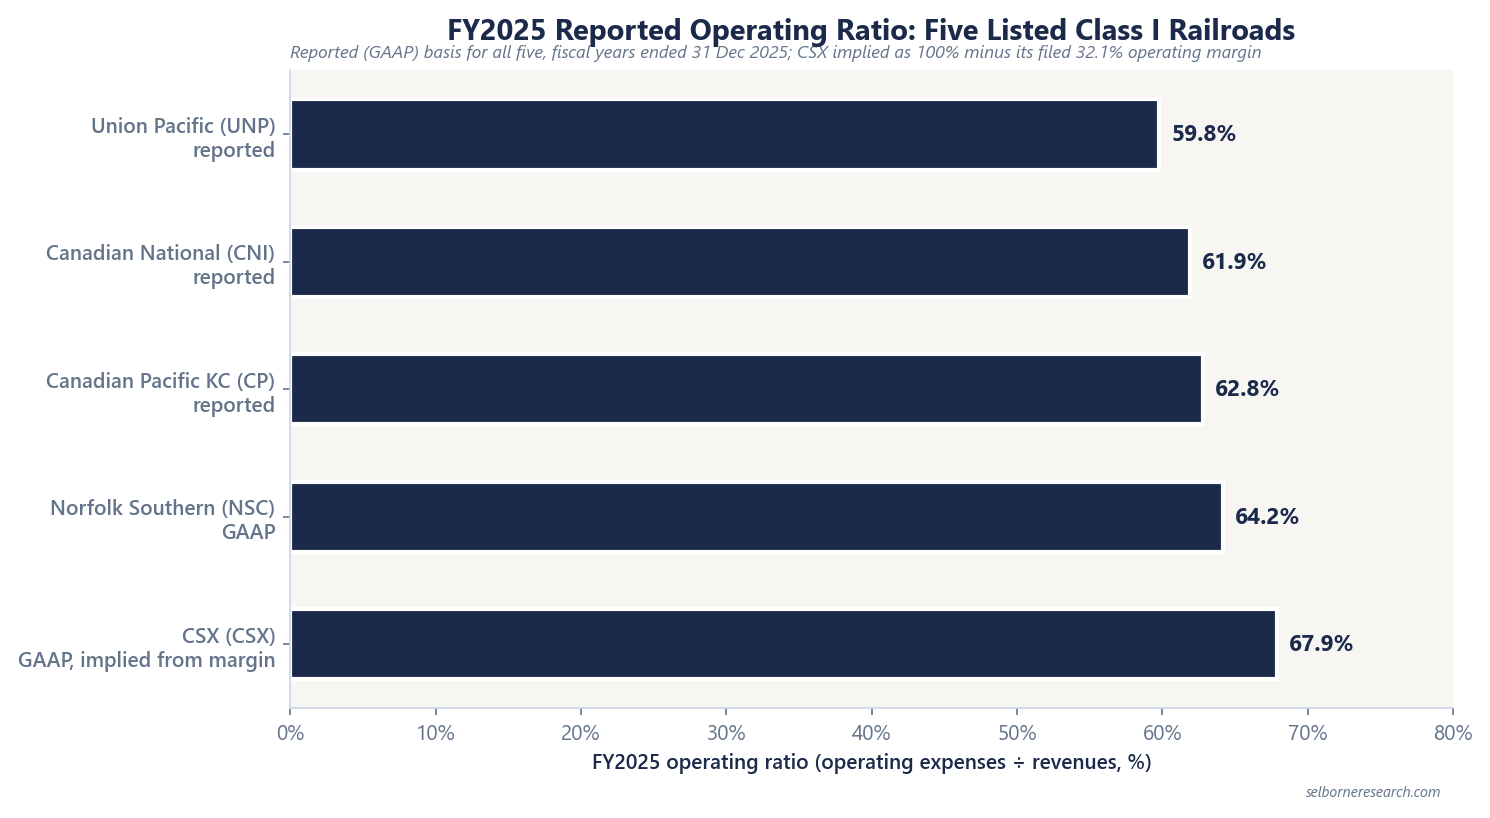
| Company | OR (basis) | Operating margin implied | Notes |
|---|---|---|---|
| Union Pacific | 59.8% reported; 59.3% adjusted | ~40.7% adj. | FY ended 31 Dec 2025 |
| CPKC | 62.8% reported; 59.9% core adjusted | ~40.1% on core adj. | Core adjusted is CPKC’s own measure, per its reconciliation |
| CN | 61.9% reported; 61.7% adjusted | ~38.3% adj. | CAD reporting; FY2025 |
| Norfolk Southern | 64.2% GAAP; 65.0% adjusted | 35.8% GAAP | −220 bps YoY on GAAP OR |
| CSX | ~67.9% GAAP implied; 66.8% adjusted | 33.2% adj. margin filed | Filings headline margin only |
Scheduled-railroading programmes explain part of the eastern gap; traffic mix and network density explain much of the remainder. The company comparison sets out both lines for each railroad and why they differ.
CSX: Margin Headlines, OR Compares
CSX’s filings give operating margin and no operating ratio, so its OR has to be derived before it goes in a peer table. FY2025 operating margin was 32.1% GAAP and 33.2% adjusted. Subtract each from 100%, or divide expenses by revenue in its quarterly financial report, and you reach the same ORs as the table. Left unconverted, CSX’s margin beside another railroad’s OR compares two different measures.
Worked Example: OR to Operating Income
Take an illustrative mid-size Class I: 5.5m carload-equivalent units at $2,400 revenue per unit (RPU, freight revenue divided by units carried) and a 61.0% OR.
| Step | Calculation | Result |
|---|---|---|
| Freight revenue | 5.5m × $2,400 | $13.2bn |
| Operating expenses | 61.0% × $13.2bn | $8.05bn |
| Operating income | $13.2bn − $8.05bn | $5.15bn (~39.0% margin) |
A 100 bps improvement in OR on that revenue adds $132m to operating income. That is why revenue per unit and OR travel together in valuation work: pricing raises revenue, and cost control shrinks the share of it that goes on expenses.
What to Watch Next
OR measures efficiency over a full year and says little about volume. A surge in low-revenue intermodal units (containers and truck trailers moved by rail) can stall RPU while OR holds steady, provided costs scale with the traffic. Read OR alongside mix and ROIC when you move from efficiency to value creation.
The operating ratio fades year by year off volume, revenue per unit and capex, feeding a value per share checked against return on capital.
The Excel model is the primer's railroad build live across 11 sheets: revenue from volume and revenue per unit, an operating ratio that fades year by year, a valuation for a mature compounder and an improvement story, a margin bridge, return on capital against the cost of capital, free cash flow and capital returns, and a sensitivity grid. Change the operating ratio path or capex and the value moves.
Frequently Asked Questions
- What is a railroad operating ratio?
- Operating ratio (OR) is operating expenses as a percentage of operating revenues, the definition Canadian National uses in its filings. Lower is better: operating margin is approximately 100% minus OR. It is the main efficiency measure for the Class I railroads, the largest North American freight carriers.
- What is a good operating ratio for a Class I railroad?
- There is no filed benchmark: none of the Class I 10-Ks we reviewed uses "sub-60%" as one. For a first sort we group ratios below 60%, from 60% to 65%, and above 65%. On FY2025 reported figures (implied, for CSX) the five listed Class I railroads ran from 59.8% to 67.9%. The basis alone can move a railroad across a group boundary, so sort on one basis and read the reasons behind each number.
- Why does CSX report operating margin instead of operating ratio?
- CSX FY2025 filings headline operating margin (32.1% GAAP, 33.2% adjusted) and do not print an operating ratio. OR is 100% minus margin, or expenses divided by revenue: 67.9% GAAP and 66.8% adjusted. Label the basis when comparing CSX with railroads that print OR directly.
- Should I use reported or adjusted operating ratio?
- Either, provided every row in a comparison uses the same one. Reported figures come straight from the GAAP income statement; adjusted figures remove items each company chooses, so two adjusted ratios can rest on different lists. Union Pacific FY2025 reported 59.8% versus 59.3% adjusted; Norfolk Southern GAAP 64.2% versus adjusted 65.0%; Canadian Pacific Kansas City 62.8% reported versus 59.9% core adjusted. State which line you are on before ranking peers.