Class I Railroad Operating Ratios Compared
FY2025 operating ratios for the five listed Class I railroads, reported and adjusted, with the basis for each row and why the two lines and railroads differ.
Educational analysis for professional use. This guide is not investment advice or a recommendation to buy or sell any security, and it is not personalised.
A Railroad Comparison Is Only as Good as the Line You Pick
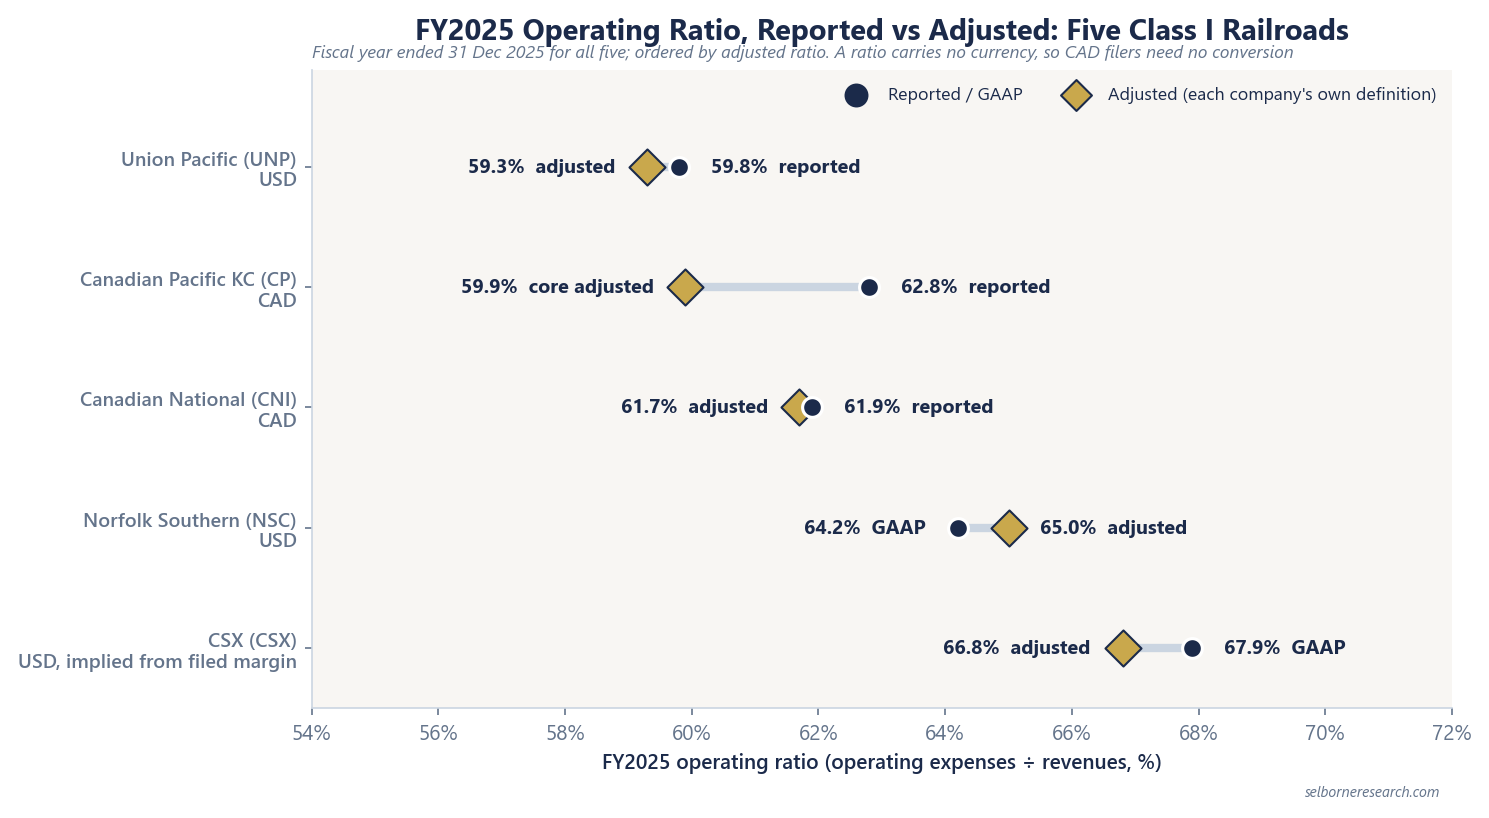
Each of the five listed Class I railroads has two operating ratios for FY2025, printed or implied: a reported figure from its GAAP income statement and an adjusted figure built to its own definition. The gap between the two runs from 0.2 points to 2.9 points, and at one railroad the adjusted figure is the higher of the pair. Put one company’s adjusted ratio next to another’s reported ratio and part of the difference you see is bookkeeping.
The ratio itself is operating expenses divided by operating revenues; the operating ratio guide covers the metric and its link to margin. All five close their fiscal year on 31 December, so FY2025 is the same twelve months for each. BNSF, a US Class I railroad, is privately owned, which is why a comparison of listed companies stops at five.
FY2025 Operating Ratios, Reported and Adjusted
| Company | Reported OR | Adjusted OR | Adjusted minus reported | Basis | Currency | Fiscal year end |
|---|---|---|---|---|---|---|
| Union Pacific | 59.8% | 59.3% | −0.5 pts | Both printed in the FY2025 earnings release | USD | 31 Dec 2025 |
| Canadian Pacific Kansas City | 62.8% | 59.9% (core adjusted) | −2.9 pts | ”Core adjusted” is the company’s own measure, reconciled in its earnings release | CAD | 31 Dec 2025 |
| Canadian National | 61.9% | 61.7% | −0.2 pts | Both printed; defined as operating expenses as a percentage of revenues | CAD | 31 Dec 2025 |
| Norfolk Southern | 64.2% (GAAP) | 65.0% | +0.8 pts | Both printed; adjusted sits above GAAP | USD | 31 Dec 2025 |
| CSX | 67.9% (implied, GAAP) | 66.8% (implied) | −1.1 pts | Not printed as a ratio: 100% minus filed operating margin of 32.1% GAAP and 33.2% adjusted | USD | 31 Dec 2025 |
Rows run in order of adjusted ratio, lowest first. The chart plots both lines for each railroad, so the size and direction of each adjustment is visible at a glance. The operating ratio guide charts a single line per railroad; the figures are the same.
Why Reported and Adjusted Part Company
An adjusted ratio takes out items the company treats as outside its normal operations: one-off charges such as restructuring, impairments or legal settlements, costs tied to an acquisition, and now and then a one-off credit. Every railroad writes its own list. Two figures both called “adjusted” can rest on different exclusions, which reported figures, drawn straight from the GAAP income statement, do not.
Three things in the table are worth reading before you compare anything.
How big the adjustment is. At Canadian National and Union Pacific the adjustment moves the ratio by half a point or less, so the two lines tell the same story. At Canadian Pacific Kansas City it moves the ratio by 2.9 points, more than the whole 2.4-point spread between Union Pacific’s and Canadian National’s adjusted figures.
Which way it goes. Adjustments usually strip out charges and pull the ratio down. When the excluded items are net credits, the adjusted ratio rises instead. Norfolk Southern’s FY2025 adjusted ratio of 65.0% sits above its 64.2% GAAP figure, and the improvement on FY2024 differs by line: 220 basis points on GAAP (from 66.4%), 80 on adjusted (from 65.8%). Quote one without the other and you have picked a story.
What the label means. “Core adjusted” is Canadian Pacific Kansas City’s own term. Its earnings release reconciles it to the reported figure item by item, and that list is what decides whether the 59.9% belongs beside another company’s adjusted ratio.
Neither line is correct on its own. State which one you are using, keep it the same across the table, and read the reconciliation wherever the gap is wide.
CSX Prints a Margin, Not a Ratio
CSX’s FY2025 filings headline operating margin: 32.1% on a GAAP basis and 33.2% adjusted. The operating ratio is 100% minus the margin, 67.9% and 66.8%, and the conversion is exact because both measures share the same denominator. The only discipline is labelling: in any table, the CSX row is implied, not printed.
Currency is the other basis question, and for this metric it falls away. Canadian National and Canadian Pacific Kansas City report in Canadian dollars, but a ratio of Canadian-dollar expenses to Canadian-dollar revenues has no unit, so the figures sit beside the US filers without conversion. Exchange rates can still nudge the ratio where a railroad earns revenue in one currency and pays costs in another, which is a real effect on the year’s result rather than a comparison problem.
Why the Five Sit Where They Do
The 7.5-point spread between the lowest and highest adjusted ratio comes from how each network is built and what it carries. Three mechanisms do most of the work, and none of them is a grade.
Density. Track, signals and yards cost much the same to keep open whether a line carries ten trains a day or thirty. More traffic over the same route miles spreads that fixed cost, so two railroads charging identical rates can post different ratios simply because one runs more tonnes over each mile of track.
Mix. Intermodal traffic, containers and truck trailers moved by rail, earns far less per unit than a carload of chemicals or grain. A network whose units each earn less must also cost less per unit to hold the same ratio.
| Railroad | Intermodal share of volume | Intermodal share of revenue | Basis |
|---|---|---|---|
| Union Pacific | ~40% | 20% of freight revenue | Revenue carloads; intermodal earned $1,380 per car against a $2,749 company average |
| Canadian Pacific Kansas City | 39.4% | 18% of freight revenue | Carloads |
| Canadian National | 40.9% | 22% of revenues | Carloads |
| CSX | 48% | – | Rail units; intermodal $692 per unit against $3,382 for merchandise |
| Norfolk Southern | 57.7% | 25% of revenue | Carloads plus intermodal units |
All figures FY2025. The two railroads with the highest adjusted ratios also carry the largest intermodal share of volume, which fits the mechanism. It does not prove it: the volume counts are defined differently from company to company, and mix is one cause among three.
Operating model. Precision scheduled railroading reorganises a network around fixed schedules, point-to-point service and fewer assets per unit of traffic. Union Pacific began its implementation in late 2018 and cited a 58.5% adjusted ratio for 2020. A change on that scale takes years to reach the ratio, and it keeps moving after it does. Of the four railroads that print an operating ratio, all four reported a lower figure in FY2025 than in FY2024: Union Pacific 59.9% to 59.8%, Canadian National 63.4% to 61.9%, Canadian Pacific Kansas City 64.4% to 62.8% and Norfolk Southern 66.4% to 64.2%. A single year’s table is a snapshot, and the order can change within one.
Reading the Table Without Grading It
When we screen, we sort ratios into three groups as a first pass: below 60%, 60% to 65%, and above 65%. That is a working convention, not a filed benchmark; none of the Class I 10-Ks we reviewed uses “sub-60%” as a benchmark phrase. The line a railroad is measured on can move it across one of those boundaries on its own, since the widest reported-to-adjusted gap among the five in FY2025 was 2.9 points. Sort on one basis, then read the density, mix and operating history behind each number before drawing anything from where it lands.
Volume, revenue per unit, the operating ratio and capex are the inputs. This primer fades the operating ratio year by year and takes the cash flow to a value per share, with return on capital as the check.
The Excel model is the primer's railroad build live across 11 sheets: revenue from volume and revenue per unit, an operating ratio that fades year by year, a valuation for a mature compounder and an improvement story, a margin bridge, return on capital against the cost of capital, free cash flow and capital returns, and a sensitivity grid. Change the operating ratio path or capex and the value moves.
Frequently Asked Questions
- Which Class I railroad had the lowest operating ratio in FY2025?
- It depends on the line you use. On adjusted figures, Union Pacific was lowest at 59.3%, with Canadian Pacific Kansas City next at 59.9% core adjusted. On reported figures, Union Pacific was lowest at 59.8%, with Canadian National next at 61.9%. CSX does not print an operating ratio: its 67.9% GAAP and 66.8% adjusted figures are implied from its filed operating margin. All five figures are for the year ended 31 December 2025.
- Why is the Norfolk Southern adjusted operating ratio higher than its GAAP ratio?
- An adjusted ratio removes items the company treats as outside normal operations. When those items are net credits in the year rather than charges, taking them out raises the ratio. Norfolk Southern reported 64.2% GAAP and 65.0% adjusted for FY2025. Its GAAP ratio improved 220 basis points on FY2024 while its adjusted ratio improved 80, so the reconciliation in its earnings release matters before quoting either improvement.
- Do Canadian National and CPKC figures need converting from Canadian dollars?
- Not for the operating ratio. Both report in Canadian dollars, and the ratio divides Canadian-dollar expenses by Canadian-dollar revenues, so the currency cancels out. Conversion matters for revenue, cash flow or market value, not for a ratio.
- What is the CPKC core adjusted operating ratio?
- It is Canadian Pacific Kansas City's own adjusted measure: 59.9% for FY2025 against 62.8% reported. The 2.9-point gap is the widest of the five listed Class I railroads. The reconciliation in its earnings release lists what core adjusted removes; read it before placing the figure beside another company's adjusted ratio, which will be built from a different list.