Intermodal Share by Railroad: Volume and Revenue
FY2025 intermodal share of volume and revenue for the five listed Class I railroads, what each counts as a unit, and why mix pulls revenue per unit down.
Educational analysis for professional use. This guide is not investment advice or a recommendation to buy or sell any security, and it is not personalised.
Intermodal Share Depends on the Unit Being Counted
Intermodal traffic, containers and truck trailers moved by rail, made up between 39% and 58% of what each listed Class I railroad moved in FY2025, and between 18% and 25% of what each earned. Both ranges are correct. They measure different things, and the volume figures do not measure the same thing as each other either, because every railroad counts in its own unit.
Union Pacific counts each container or trailer as one revenue carload. CSX counts rail units across merchandise, intermodal and coal. Norfolk Southern adds its carloads and its intermodal units together. Canadian National and Canadian Pacific Kansas City report carloads. A share of volume is always a share of one company’s own count, so part of any gap between two railroads is a gap between two definitions. The operating ratio comparison sets these shares beside each network’s efficiency; the rest of this page is about what the shares themselves mean.
FY2025 Intermodal Share of Volume and Revenue
| Company | Share of volume | What counts as one unit | Share of revenue | Revenue line | Currency | Fiscal year end |
|---|---|---|---|---|---|---|
| Norfolk Southern | 57.7% (4.1m of 7.1m) | Carloads plus intermodal units, added together | 25% | Revenue | USD | 31 Dec 2025 |
| CSX | 48% (2.995m of 6.307m) | Rail units: merchandise, intermodal and coal | Not filed as a share | Revenue per unit filed by line instead | USD | 31 Dec 2025 |
| Canadian National | 40.9% (2.234m of 5.458m) | Carloads | 22% (C$3,892m) | Total revenues | CAD | 31 Dec 2025 |
| Union Pacific | 39.7% (3.357m of 8.447m) | Revenue carloads; each container or trailer counts as one | 20% ($4,632m of $23,220m) | Freight revenue | USD | 31 Dec 2025 |
| Canadian Pacific Kansas City | 39.4% (1.781m of 4.514m) | Carloads | 18% (of C$14,776m) | Freight revenue | CAD | 31 Dec 2025 |
Rows run by share of volume, highest first. Norfolk Southern carries the largest intermodal share of volume of the five, and the largest of the four filed shares of revenue. The three railroads that report carloads sit within 1.5 points of each other on volume but four points apart on revenue, an early sign that what an intermodal unit earns varies more from network to network than the share of traffic it takes.
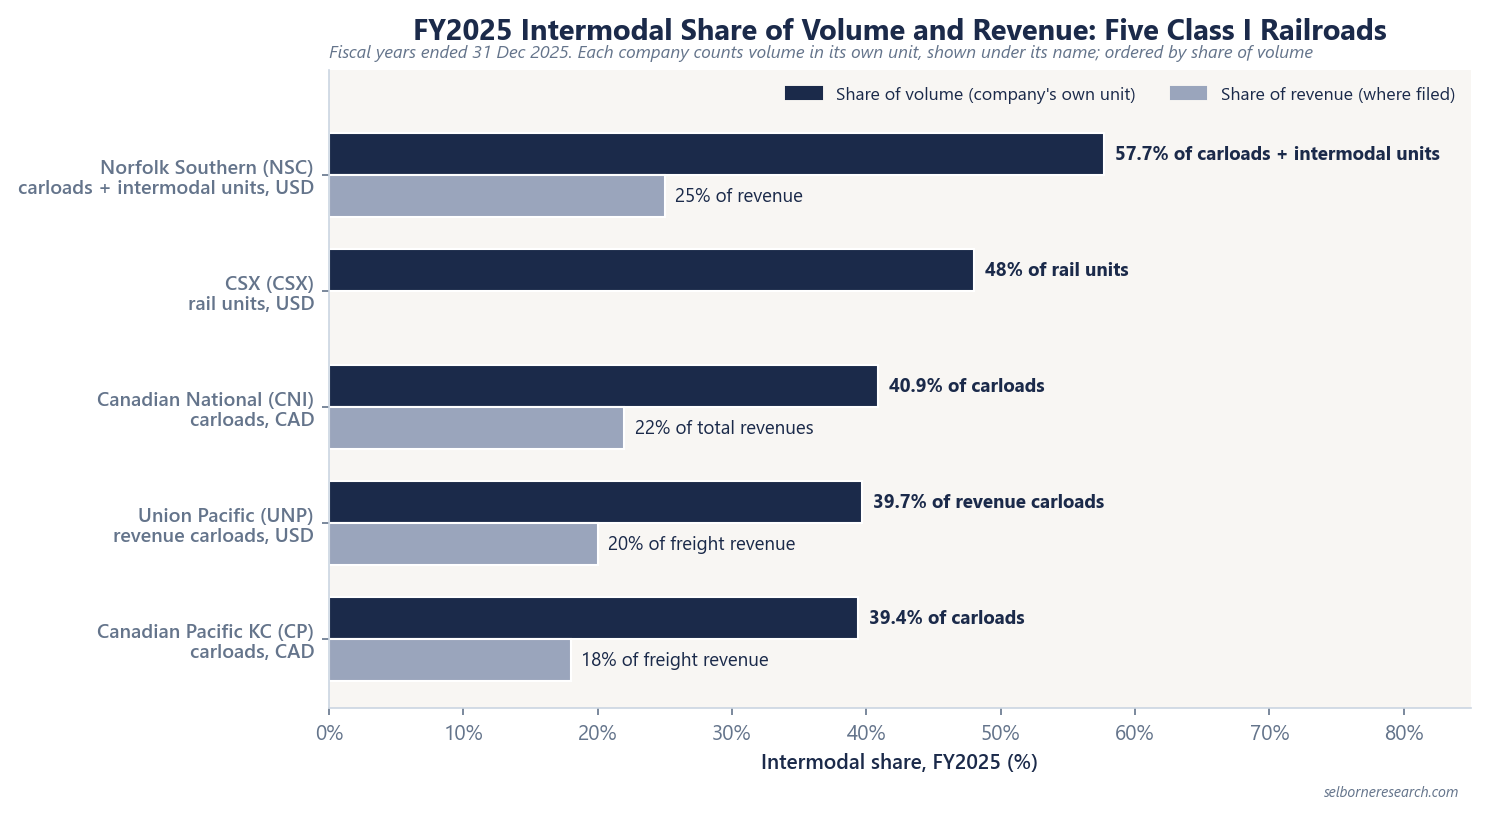
Why Share of Revenue Sits Below Share of Volume
An intermodal unit earns between about a third and three-fifths of what the railroad’s average unit earns, so its share of revenue lands well below its share of volume. The link is exact arithmetic:
Share of revenue = share of volume × (intermodal revenue per unit ÷ average revenue per unit)
Union Pacific shows it cleanly because it files every term on one basis. Intermodal earned $1,380 per car in FY2025 against a company average of $2,749, a ratio of 0.50. Multiply 39.7% by 0.50 and you get 20%, the filed share of freight revenue.
| Company | Intermodal revenue per unit | Average revenue per unit | Intermodal ÷ average | Basis |
|---|---|---|---|---|
| Union Pacific | $1,380 | $2,749 | 0.50 | Freight revenue per revenue carload, USD |
| Canadian National | C$1,742 | C$3,056 | 0.57 | Freight revenue per carload, CAD |
| CSX | $692 | $2,234 | 0.31 | Revenue per rail unit, USD; merchandise earned $3,382 |
All three are for the year ended 31 December 2025. The ratio has no currency, so the Canadian row sits beside the US ones without conversion, even though the per-unit figures themselves cannot be compared across currencies. Where only the two shares are to hand, dividing one by the other gives the same reading: about 0.43 at Norfolk Southern (25% ÷ 57.7%) and 0.46 at Canadian Pacific Kansas City (18% ÷ 39.4%), on revenue shares rounded to whole percentages.
Canadian National’s two routes to the ratio disagree slightly, 0.57 from per-car revenue against 0.54 from the shares. The reason is the denominator: its 22% is a share of total revenues, which include non-freight revenue, while the per-car figures are freight revenue only. Its intermodal share of freight revenue alone is a little above 22%. Check which revenue line a share sits on before setting it beside another railroad’s.
Canadian Pacific Kansas City files a third denominator. Intermodal was 39.4% of its carloads but 17.5% of its revenue ton-miles, a measure that weights each shipment by tonnes and distance rather than counting a container and a loaded bulk car as one each. On that basis the intermodal share almost matches the 18% share of freight revenue. The unit you count decides whether intermodal looks like two-fifths of the railroad or under a fifth.
How a Rising Intermodal Share Pulls Down Revenue per Unit
Average revenue per unit is a weighted average of lower-yielding intermodal units and higher-yielding carloads, so it falls when the mix tilts toward intermodal, even in a year when every line reprices up. The revenue per unit guide covers how each railroad defines its headline figure; the mechanism below applies whatever the definition.
Start from Union Pacific’s FY2025 per-car figures: intermodal at $1,380, everything else at about $3,652 (freight revenue less intermodal revenue, divided by non-intermodal carloads), and an average of $2,749. Now suppose every line reprices up 2% in a year and intermodal’s share of carloads rises three points. The second row is a demonstration, not a forecast.
| Case | Intermodal share of carloads | Intermodal per car | All other per car | Average per car |
|---|---|---|---|---|
| FY2025, filed | 39.7% | $1,380 | ~$3,652 | $2,749 |
| Every line +2%, share +3 pts | 42.7% | ~$1,408 | ~$3,725 | ~$2,734 |
The average falls by about $15, roughly 0.5%, in a year when every price rose 2%. At these figures each point of carload share that moves to intermodal takes about $23 off the average: the $2,272 gap between the two lines, divided by 100. A 1% rise on every line adds about $27. A shift of about 1.2 points in a year is therefore enough to cancel a 1% across-the-board price rise in the headline figure.
The filings show the same pattern. Union Pacific’s FY2025 average revenue per car was flat while freight revenue excluding fuel surcharge rose 3%, with mix and fuel surcharge between the two figures. At Canadian Pacific Kansas City, intermodal carloads grew 8% against 3% for all carloads, which lifted intermodal’s share from 37.6% to 39.4%; revenue per carload of C$3,273 rose 1% as reported and fell 1% after adjusting for currency. That is consistent with a mix drag, but the company does not split the move into price and mix, so it is not evidence of a price cut either.
Reading an Intermodal Share Figure
Carry the company’s own unit with every share. A 57.7% share of carloads plus intermodal units and a 39.7% share of revenue carloads come from different counts, so treat a gap of a few points between two railroads as possibly definitional before treating it as traffic. The same railroad over several years is a cleaner comparison than five railroads in one year, because the unit stays fixed.
Name the revenue line too. Union Pacific and Canadian Pacific Kansas City state intermodal as a share of freight revenue, Canadian National as a share of total revenues, and Norfolk Southern as a share of revenue. CSX states neither and files revenue per unit by line, which answers the same question from the other side.
A falling average revenue per unit alongside a rising intermodal share says nothing on its own about pricing. Check revenue per unit line by line, or revenue excluding fuel surcharge, before reading a softer headline as weaker rates. Intermodal can dilute the average while adding traffic over track that costs much the same to keep open either way, which is why a lower average can sit beside a better operating ratio. Truck competition sets the ceiling on what that traffic pays, and the intermodal versus trucking guide covers where the ceiling comes from.
Volume, revenue per unit, the operating ratio and capex are the inputs. This primer fades the operating ratio year by year and takes the cash flow to a value per share, with return on capital as the check.
The Excel model is the primer's railroad build live across 11 sheets: revenue from volume and revenue per unit, an operating ratio that fades year by year, a valuation for a mature compounder and an improvement story, a margin bridge, return on capital against the cost of capital, free cash flow and capital returns, and a sensitivity grid. Change the operating ratio path or capex and the value moves.
Frequently Asked Questions
- Which Class I railroad has the highest intermodal share of volume?
- Norfolk Southern, at 57.7% of its FY2025 volume, counted as carloads plus intermodal units (4.1m of 7.1m). CSX is next at 48% of rail units. Canadian National (40.9%), Union Pacific (39.7%) and Canadian Pacific Kansas City (39.4%) all sit near 40% of carloads. Each railroad counts volume in its own unit, so a gap of a few points between two of them can come from the definitions rather than the traffic.
- Why is a railroad's intermodal share of revenue lower than its share of volume?
- Because an intermodal unit earns less than the railroad's average unit. Share of revenue equals share of volume multiplied by intermodal revenue per unit divided by average revenue per unit. At Union Pacific in FY2025, intermodal earned $1,380 per car against a $2,749 average, a ratio of 0.50, so a 39.7% share of carloads became 20% of freight revenue.
- Does CSX report intermodal as a share of revenue?
- Not as a share. CSX files intermodal as 48% of its FY2025 rail units and gives revenue per unit by line: $692 for intermodal, $3,382 for merchandise and $2,234 for all units. On those figures an intermodal unit earned about 0.31 of the average unit, all in US dollars for the year ended 31 December 2025.
- Can average revenue per unit fall when every price goes up?
- Yes, if the mix moves toward the lower-yielding unit. Taking Union Pacific FY2025 per-car figures as a demonstration, a 2% rise on every line combined with a three-point rise in intermodal share of carloads lowers the average from $2,749 to about $2,734. At those figures each point of share that moves to intermodal takes about $23 off the average.