Revenue per Unit and the Mix Effect
Railroad revenue per unit defined by each filer's basis, why intermodal pulls the headline average down, and how to separate mix from price.
Educational analysis for professional use. This guide is not investment advice or a recommendation to buy or sell any security, and it is not personalised.
Headline RPU Is a Mix-Weighted Average, Not Pure Pricing
Revenue per unit (RPU) is freight revenue divided by carloads or total rail units. It is the quickest read on yield, but it blends pricing, fuel surcharges (the fuel cost a railroad passes on to shippers), contract mix and commodity exposure. Intermodal traffic, containers and truck trailers carried on rail, earns fewer dollars per unit than bulk or industrial carloads while adding train length and network density. So a railroad can report positive merchandise pricing and still show flat or falling total RPU when intermodal share rises or coal RPU weakens.
The Intermodal Dilution Pattern
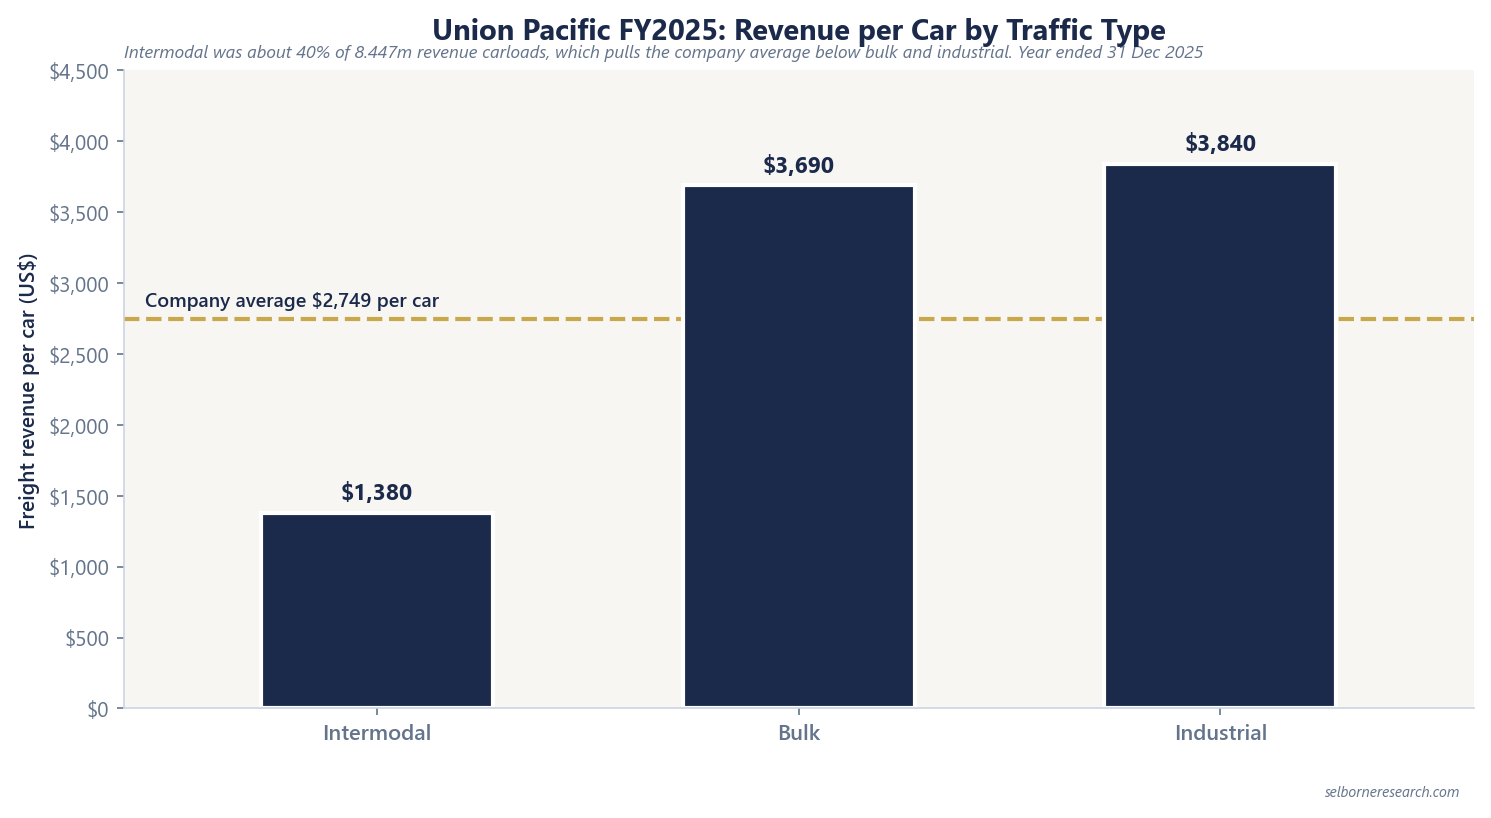
Union Pacific’s FY2025 figures (year ended 31 Dec 2025) show the pattern cleanly:
| Union Pacific traffic type | Revenue per car | Share of carloads |
|---|---|---|
| Intermodal | $1,380 | 3.357m (~40% of carload count) |
| Bulk | $3,690 | – |
| Industrial | $3,840 | – |
| Company average | $2,749 | 8.447m revenue carloads |
Intermodal brought in $4,632m, 20% of freight revenue, at those lower per-car yields. The company average sits between the two groups because it is weighted by mix.
FY2025 Headline RPU by Company
Among the three US filers, the two with the heaviest intermodal unit shares, CSX and Norfolk Southern, print the lowest headline RPUs. That is the mix effect at work. Each company picks its own denominator (CSX total rail units, Union Pacific revenue carloads), and Canadian National (CN) and Canadian Pacific Kansas City (CPKC) report in Canadian dollars, so check each figure’s basis before setting it against another.
| Company | Headline RPU | YoY change | Basis note |
|---|---|---|---|
| CSX | $2,234 | −4% | Per rail unit, 6.307m units; merchandise +1%, coal −13% |
| Norfolk Southern | $1,724 | +0.3% | Per unit, carloads plus intermodal; RPU less fuel $1,607 (+1.6%) |
| Union Pacific | $2,749 avg/car | Flat | Per revenue carload; freight revenue ex fuel surcharge +3% |
| CPKC | C$3,273/carload | +1% (−1% FX-adjusted) | Freight revenue per carload; CAD |
| CN | C$3,056/carload | Flat (−1% constant currency) | Freight revenue per carload; CAD; intermodal C$1,742/car (−2%) |
Revenue Mix Versus Unit Mix
Wherever both are filed, intermodal’s share of units runs ahead of its share of revenue, because each intermodal unit pays less:
| Company | Intermodal unit/carload share | Intermodal revenue share (where filed) |
|---|---|---|
| CSX | 48% of 6.307m units | Lower per-unit RPU than merchandise |
| Norfolk Southern | 57.7% of 7.1m units | 25% of revenue (merchandise 63%) |
| CPKC | 39.4% of carloads | 18% of C$14,776m freight revenue |
| CN | 40.9% of 5.458m carloads | 22% of revenues (C$3,892m intermodal) |
At Norfolk Southern intermodal is most of the units, while merchandise (mixed carload freight such as chemicals, metals and autos) earns most of its revenue. At CPKC, bulk (36%) and merchandise (46%) earn most of the freight revenue.
Worked Example: Mix Shifts Headline RPU
Stay with Union Pacific’s FY2025 filed figures:
| Line | Calculation | Result |
|---|---|---|
| Intermodal revenue | 3.357m cars × $1,380 | ~$4,632m (filed $4,632m) |
| Non-intermodal revenue | $23,220m freight − $4,632m | ~$18,588m |
| Non-intermodal carloads | 8.447m − 3.357m | 5.090m |
| Implied non-intermodal RPU | $18,588m ÷ 5.090m | ~$3,652/car |
Each intermodal car earns $1,380 against roughly $3,652 for the rest of the network. So if intermodal’s share of carloads rose one point with per-car yields unchanged, headline average RPU would fall with no change in merchandise or bulk pricing. Analysts separate that mix effect from core price on earnings calls.
Reading RPU With OR
RPU tells you what each unit paid; operating ratio tells you what share of that dollar became margin. Intermodal can dilute RPU while helping OR through density and train utilisation. Intermodal versus truck economics set the competitive ceiling on intermodal pricing.
The operating ratio fades year by year off volume, revenue per unit and capex, feeding a value per share checked against return on capital.
The Excel model is the primer's railroad build live across 11 sheets: revenue from volume and revenue per unit, an operating ratio that fades year by year, a valuation for a mature compounder and an improvement story, a margin bridge, return on capital against the cost of capital, free cash flow and capital returns, and a sensitivity grid. Change the operating ratio path or capex and the value moves.
Frequently Asked Questions
- What is railroad revenue per unit (RPU)?
- RPU is freight revenue divided by carloads or total rail units, depending on the filer. Union Pacific reports revenue per car on revenue carloads; CSX reports total RPU on 6.307m rail units (merchandise, intermodal and coal combined). Canadian National reports C$3,056 per carload. Match the denominator to the definition each filer uses before ranking peers.
- Why does intermodal lower headline RPU?
- Intermodal moves containers and truck trailers at lower revenue per unit than bulk or industrial carloads, but it adds network density. Union Pacific FY2025 intermodal averaged $1,380 per car against a company average of $2,749. More intermodal units in the mix pull headline RPU down even when core merchandise pricing is positive.
- Can RPU fall when pricing is actually up?
- Yes. CSX FY2025 total RPU fell 4% to $2,234 while merchandise RPU rose 1%; coal RPU fell 13% and intermodal RPU fell 2%. Fuel surcharges, mix shifts and commodity exposure can hold aggregate RPU flat or push it down while merchandise pricing is positive.
- How do US and Canadian RPU figures compare?
- Canadian National reports C$3,056 per carload (flat reported, −1% constant currency) for FY2025, with intermodal at C$1,742 per car (−2%). Canadian Pacific Kansas City reports C$3,273 per carload (+1% reported, −1% FX-adjusted). Canadian-dollar and US-dollar RPUs cannot share a ranking without conversion.