Time-Charter Equivalent (TCE) Explained
The Frontline-filed TCE definition, FY2025 achieved rates by segment, Baltic benchmarks vs company TCE, and why liner $/TEU is not TCE.
Educational analysis for professional use. This guide is not investment advice or a recommendation to buy or sell any security, and it is not personalised.
TCE Is the Shipowner’s Unit of Account
Time-charter equivalent (TCE) turns every way of employing a ship into one daily earnings rate. On a single voyage at the going (spot) rate the owner pays fuel and port costs; on a time charter, a rental at fixed daily hire, the charterer does. Deducting those costs puts the two on one footing.
Frontline’s SEC-filed definition is operating revenues less voyage expenses and commission, divided by on-hire days: days available, less days out of service (off-hire). It works across crude tankers, product tankers and dry bulk.
A route index, a container freight rate and a floating LNG plant’s tariff all measure something else. Reading one of them as TCE is the commonest mistake.
Achieved TCE vs Route Benchmarks
A route benchmark says where the market is; achieved TCE is what one company earned. The Baltic Exchange publishes daily rates for standard routes such as TD3C, a very large crude carrier (VLCC) sailing from the Middle East Gulf to China.
VLCCs are the largest crude tankers, then Suezmax and LR2/Aframax; MR and Handymax are smaller product tankers; Capesize are the largest dry bulk ships.
| Company and class | FY2025 achieved TCE |
|---|---|
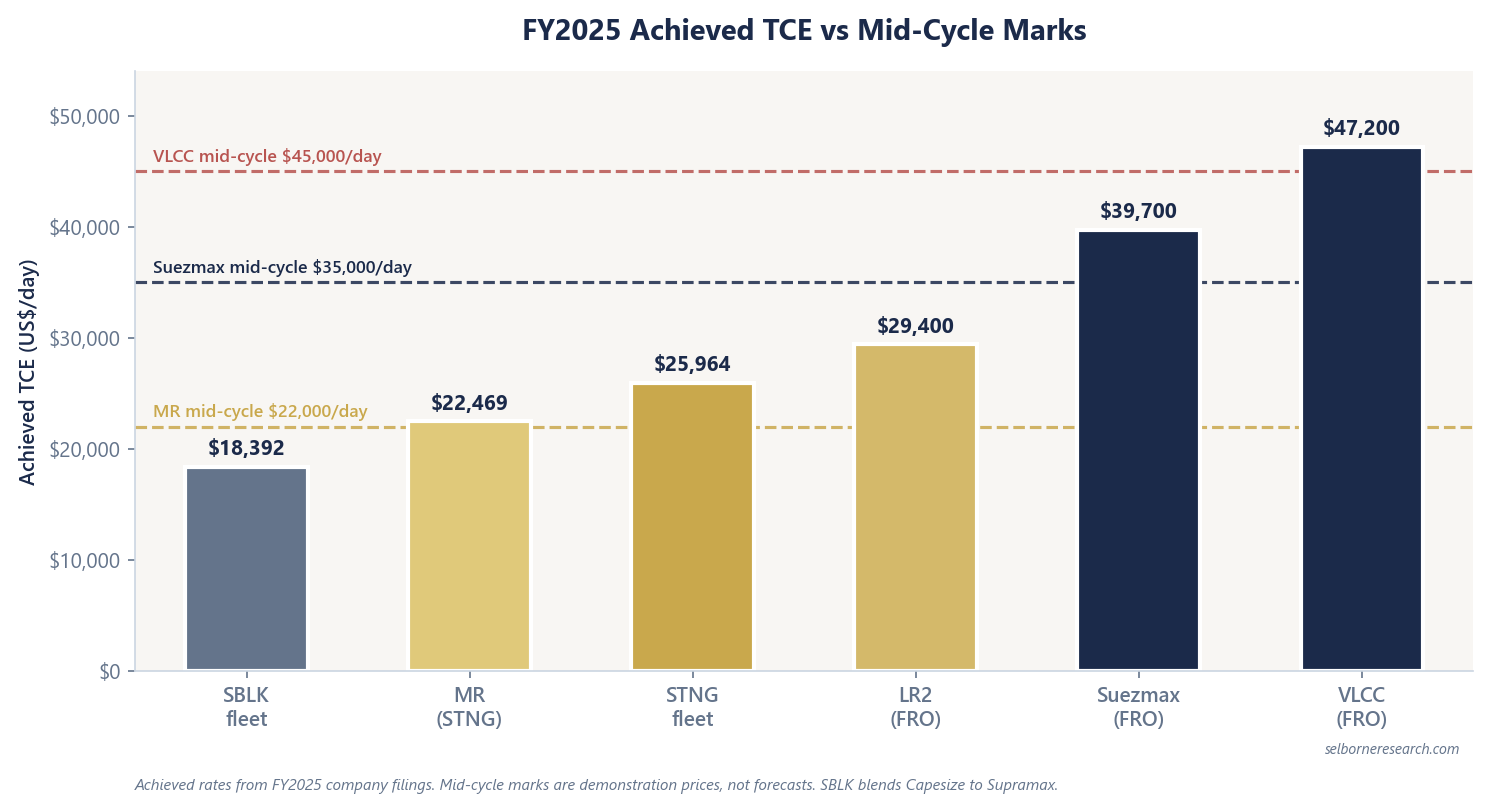
| Frontline VLCC spot | $47,200/day |
| Frontline Suezmax spot | $39,700/day |
| Frontline LR2/Aframax spot | $29,400/day |
| Scorpio Tankers fleet average | $25,964/day |
| Scorpio Tankers LR2 / MR / Handymax | $32,138 / $22,469 / $21,179 |
| Star Bulk fleet-weighted | $18,392/day |
| Danaos containerships | $35,892/day |
| Danaos dry bulk (Capesize) | $18,175/day |
The worked examples use mid-cycle marks: VLCC $45,000/day, Suezmax $35,000/day, Capesize $22,000/day, MR product $22,000/day, and $2,200/FEU (per forty-foot container) on the Drewry World Container Index. They are demonstration prices, not forecasts. Valuation work, including net asset value (fleet market value less net debt), uses mid-cycle marks because benchmarks spike: in June 2026 TD3C touched ~$400,700/day on a geopolitical shock.
What Is Not TCE
ZIM and Golar LNG report something else; Danaos reports true TCE on a different kind of book.
ZIM is a container liner, selling space to cargo owners. About 87.5% of its vessels are chartered in (~86.4% of capacity in TEU, twenty-foot containers), and the hire it owes shipowners dominates its balance sheet. It reports an average freight rate of $1,551/TEU for FY2025 on 707,528 TEU of capacity; owner-style TCE does not apply.
Golar LNG runs floating plants that liquefy gas at sea. At 31 December 2025 it had two, the Hilli (2.45 MTPA, million tonnes a year, 100% owned) and the Gimi (2.7 MTPA, 70% owned), plus one MKII unit under conversion. Having left LNG-carrier shipping, it earns liquefaction fees and disclosed no fleet TCE for FY2025.
Danaos rents its containerships to liners on multi-year charters and also owns 10 Capesize bulkers. Its table figures are genuine owner TCE, on rates contracted years ahead, so they change only as charters roll over.
Worked Mini-Example: VLCC Margin at Mid-Cycle TCE
An owner’s costs are largely fixed, so a small move in TCE moves profit a lot. Take a hypothetical owner of 10 VLCCs. Cash breakeven is the daily TCE that covers running costs, interest and debt repayments.
| Input | Value |
|---|---|
| Mid-cycle VLCC TCE | $45,000/day |
| Cash breakeven | $24,000/day |
| On-hire days per ship per year | 350 |
Margin per vessel per day: $45,000 − $24,000 = $21,000/day.
Across the fleet, per year:
350 days × $21,000 × 10 = $73.5m
Frontline’s FY2025 VLCC figure of $47,200/day, less its forward breakeven estimate of $25,000/day (disclosed 27 February 2026), leaves $22,200/day. The breakeven covers opex, dry docks (the periodic out-of-water overhaul), interest, scheduled loan repayments and G&A, so the margin is what is left for dividends and growth. A 10% fall in TCE ($4,720/day) removes about a fifth of it.
Reading TCE in Filings
Before comparing owners, ask how each fleet was employed. Is the average spot-weighted, as at Frontline and Scorpio Tankers, or charter-weighted, as at Danaos? Then split by class: Frontline reports VLCC, Suezmax and LR2; Scorpio reports LR2, MR and Handymax. Check off-hire and dry-docking, because on-hire days are the denominator.
Use route benchmarks for the market’s direction only. Carry spike TCE into dividend capacity or a broker’s NAV without normalising it, and value is overstated.
Each vessel is valued on charter income, running costs and scrap over its remaining life, summed to a fleet NAV net of debt, stressed through a freight downturn.
The Excel model is the primer's fleet NAV build live across 11 sheets: each vessel valued on its cash flows over the life it has left plus scrap, fleet NAV to equity for a spot tanker owner and a contracted lessor, an implied-multiple cross-check, a built cash breakeven, a freight-trough scenario and sensitivity grids. Change the charter rate, running costs, fleet age or debt and the NAV moves.
Frequently Asked Questions
- What is time-charter equivalent (TCE)?
- Frontline defines TCE as operating revenues less voyage expenses and commission. TCE per day divides that by on-hire days: available days less days out of service (off-hire). It puts voyage, spot and time-charter employment on the same per-day basis.
- What is the difference between TCE and Baltic route benchmarks?
- Baltic Exchange assessments, such as TD3C for crude tankers or the Capesize 5TC route average, are market references. Achieved TCE reflects one fleet's mix, employment, off-hire and commissions: Frontline earned $47,200/day on its VLCCs in FY2025. Benchmarks can spike far above mid-cycle levels, so neither stands in for the other in a model.
- Is ZIM average freight rate the same as TCE?
- No. ZIM reports container revenue divided by containers carried: $1,551/TEU in FY2025. That is a liner freight yield on a fleet ~87.5% chartered-in, and it does not compare with the per-day figures Frontline and Scorpio Tankers report as owners.
- Does Golar LNG report fleet TCE?
- No. Golar left conventional LNG-carrier shipping in 2025 and disclosed no fleet TCE for FY2025. Its floating LNG plants earn liquefaction fees and sales-type lease income, which need a different valuation frame from tanker TCE.