Aerospace Aftermarket Revenue Mix by Company
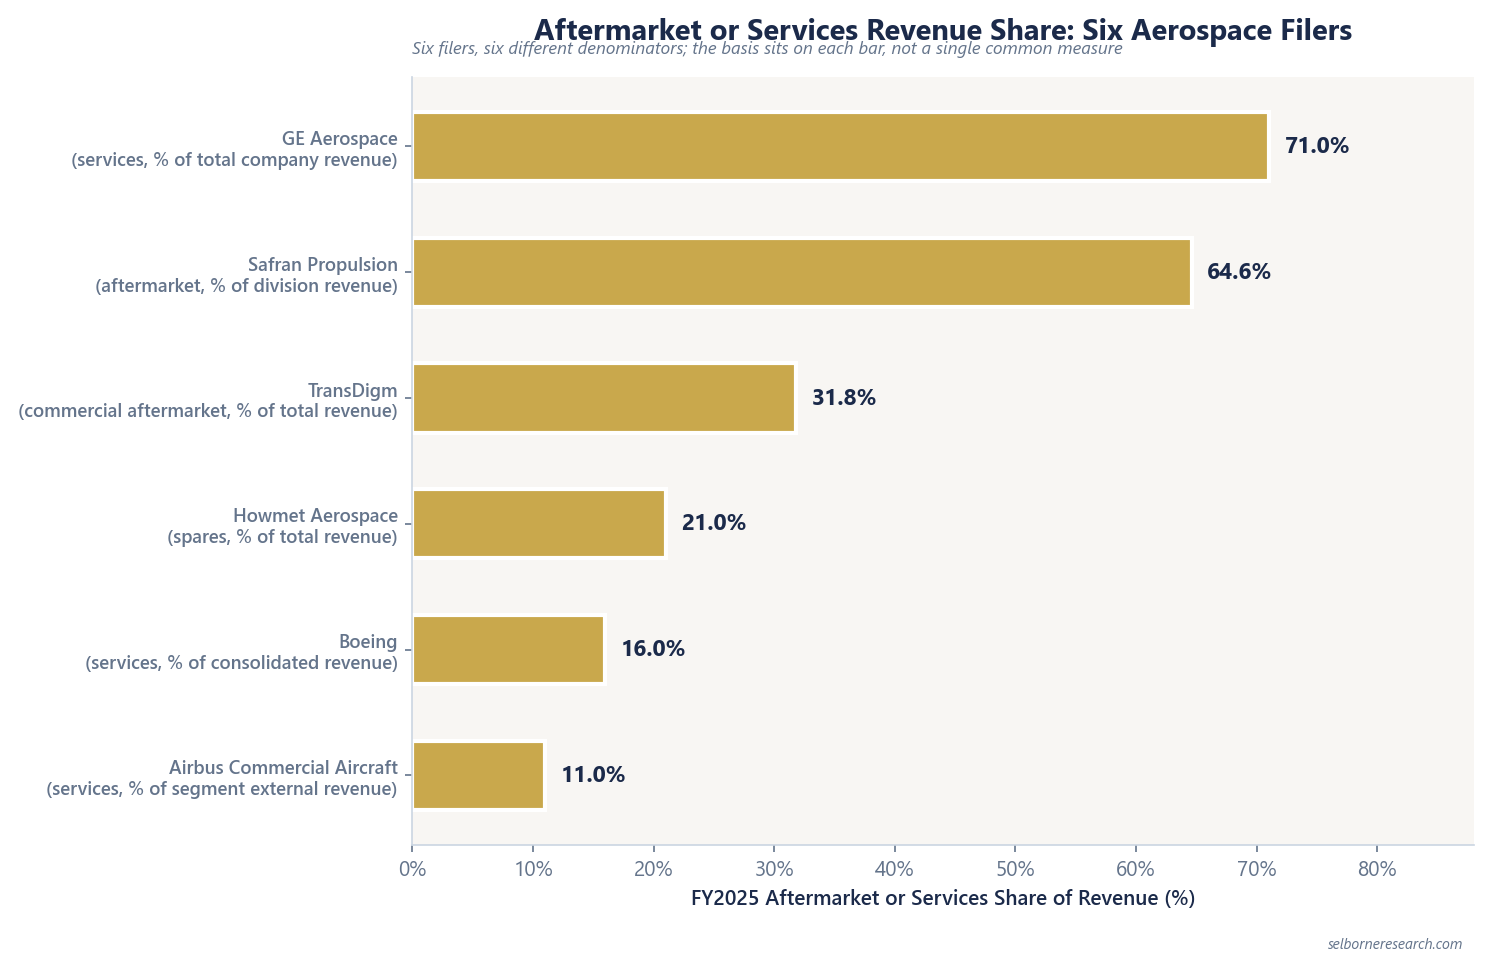
FY2025 aftermarket or services revenue share ranked across six aerospace filers, with the basis behind each filed figure stated on every row.
Educational analysis for professional use. This guide is not investment advice or a recommendation to buy or sell any security, and it is not personalised.
A Ranked Share Only Means What It Says Once You Know What Sits in the Denominator
The share of revenue coming from aftermarket or services work is the single biggest driver of margin in commercial aerospace: new equipment ramps and certification spend eat cash, while spares, repair and long-term service agreements on the fleet already flying pay it back. Every one of the six large filers in this value chain, airframers, engine makers and a proprietary-parts supplier, discloses some version of that split. None of them discloses it the same way.
Boeing splits consolidated revenue into Products and Services. Airbus splits its Commercial Aircraft segment into Platforms and Services. GE Aerospace splits both the whole company and its Commercial Engines & Services (CES) business into Equipment and Services. Safran splits its Propulsion division into OE and aftermarket. Howmet reports a spares share of total revenue. TransDigm splits total revenue into commercial aftermarket, commercial OEM and defence. Rank the six headline percentages without the basis attached and the table looks like a clean like-for-like comparison. It isn’t one, and that gap is where a ranking of this metric goes wrong.
No Two Companies Rank on the Same Basis
The table ranks the six filers on the aftermarket or services share each one actually discloses, with the basis stated on every row. Where a margin filed at that same scope exists, it sits in the last column; where it doesn’t, the gap is marked rather than papered over.
| Rank | Company | FY2025 share | Basis | Filed margin, same scope |
|---|---|---|---|---|
| 1 | GE Aerospace | 71% | Services, % of total company revenue | Not filed at this scope |
| 2 | Safran Propulsion | 64.6% | Aftermarket, % of Propulsion division revenue | 23.0% recurring operating margin |
| 3 | TransDigm | 31.8% | Commercial aftermarket, % of total revenue (defence 42.6% reported separately) | Not filed at this scope |
| 4 | Howmet Aerospace | ~21% | Spares, % of total revenue | Not filed at this scope |
| 5 | Boeing | 16% | Services, % of consolidated revenue (the Products/Services split covers the whole business; BGS is a narrower slice) | Not filed at this scope |
| 6 | Airbus Commercial Aircraft | 11% | Services, % of segment external revenue | 10.4% EBIT Adjusted margin |
Howmet’s spares share rose from ~17% in FY2024 to ~21% in FY2025, with commercial engine spares up 44% year on year. It is the only year-on-year move disclosed in this set; every other FY2025 figure here is a single-year snapshot.
What Each Filer Actually Counts
Six companies, six definitions, and the differences are wide enough to matter.
Boeing files Products and Services as a consolidated split (Products $75.4bn, Services $14.1bn, FY2025), covering the whole business rather than one segment. This is not the same thing as the Boeing Global Services (BGS) segment on its own. BGS revenue used for its own margin disclosure is around $20.9bn, so BGS alone runs closer to a quarter of consolidated revenue than the 16% Services-category figure, because BGS carries some product-type revenue and the other two segments carry some service-type revenue that all lands inside the same consolidated split.
Airbus reports Platforms and Services only within its Commercial Aircraft segment, which is one of three Airbus Group segments (the others are Helicopters and Defence and Space). The 11% figure says nothing about services revenue in the other two segments or at the group level.
GE Aerospace reports two versions: a total company split (Equipment 29%, Services 71%) and a narrower CES split (Equipment 25%, Services 75%). CES is the commercial-weighted piece of the business; the total company figure also includes GE’s non-CES activity. The 71% ranked above is the total company figure, and it does not have a margin filed to match it. Only the CES-scope 75% pairs with a filed margin.
Safran Propulsion splits OE (€5.5bn) and aftermarket (€10.1bn) within the Propulsion division alone, one of Safran’s several divisions. The 64.6% figure and the 23.0% margin beside it in the table below share the same division, which is the cleanest match in this set.
Howmet discloses spares as a share of total company revenue. Spares are physical parts sold into the repair channel; Howmet does not separately break out repair or overhaul revenue, so ~21% covers parts only.
TransDigm splits total revenue three ways: commercial aftermarket, commercial OEM and defence, reported as three separate lines rather than an OE-versus-aftermarket binary. The 42.6% defence line is not folded into either the aftermarket or the OEM figure, and the filing does not say what share of that defence revenue is itself spares or repair work.
Margin Follows Mix, Where the Basis Actually Matches
Mix drives margin, but only three of the six filers give you a margin measured on the same population as their mix figure. Stack those three side by side and the relationship holds:
| Company / segment | Mix in this scope | Filed margin, same scope |
|---|---|---|
| Safran Propulsion | Aftermarket 64.6% | Recurring operating margin 23.0% |
| GE CES (versus GE Aerospace total) | Services 75% | Operating margin 26.6% |
| Airbus Commercial Aircraft | Services 11% | EBIT Adjusted margin 10.4% |
Airbus’s 10.4% looks low against Safran’s 23.0% and GE CES’s 26.6%, but the segments aren’t equivalent: Airbus Commercial Aircraft is still 89% platforms by revenue, so its blended margin reflects an OE-heavy mix, while Safran Propulsion and GE CES both carry a majority-services mix into their blended figure. None of the three companies discloses a services-only or aftermarket-only margin stripped of the OE portion; all three numbers above are blended segment or division margins, which is the closest any of them gets.
Boeing, TransDigm and Howmet don’t clear this bar. Boeing’s closest proxy is BGS operating margin (around 18.5%, excluding a one-time gain), but BGS is a segment while the 16% mix figure is a consolidated category, so the two describe different populations. TransDigm and Howmet don’t file a margin split at the aftermarket-versus-OEM or spares-versus-total basis at all; their EBITDA and gross margin figures are reported at the whole-company level, blending both sides of the business into one number.
Across the Industry, Aftermarket Runs 15 to 25 Points Above OE
Beneath the six filers sits an industry-level pattern from a third-party study that explains why the mix matters as much as it does. IATA and Oliver Wyman, reporting on the wider engine supply chain in October 2025, put engine manufacturing gross margins at negative 5% to positive 10%, against engine maintenance, repair and overhaul (MRO) gross margins of 20% to 35%. New engines can carry list-price discounts of 80% or more against list, with the OEM recovering the economics later, through decades of shop visits and spares on the installed fleet.
| Stage | Range |
|---|---|
| Engine OEM manufacturing | −5% to +10% gross margin |
| Engine MRO | 20-35% gross margin |
| Initial list-price discount on new engines | Up to 80%+ |
We use a working convention, stated here rather than sourced from any third party: a typical aftermarket segment runs 15 to 25 percentage points above OE margin on the same value chain. It’s anchored by two things the filed numbers actually show, Boeing’s own BCA-to-BGS spread (around 36 percentage points, wider than the band) and the IATA engine ranges above. Individual filers land above or below the band depending on where they sit in the chain and how mature their installed base is.
Where a Naive Ranking Goes Wrong
Three mistakes turn up when this table gets built in a hurry.
Comparing GE’s total-company 71% against Safran’s division-level 64.6% as though both describe the same population. GE’s figure includes the whole of GE Aerospace; Safran’s covers Propulsion only, one division among several. The narrower, CES-only GE figure (75%) is the closer match to Safran’s scope, not the headline 71%.
Reading Boeing’s 16% Services-category share as the BGS segment’s weight in the business. It isn’t. BGS revenue on its own is closer to a quarter of Boeing’s consolidated total, because the Products/Services split cuts across all three of Boeing’s segments rather than isolating BGS.
Treating Howmet’s ~21% spares figure and GE’s 71% services figure as measuring the same thing because both get called “aftermarket” in conversation. Spares is a narrower category than services: it captures the sale of physical parts, and Howmet doesn’t separately disclose repair or overhaul revenue. There’s no way to know how much bigger its true aftermarket exposure is once repair and overhaul activity, if any, gets added back.
The fix in each case is the same: state the basis next to the number, every time, before the number goes in a table with five others.
Commercial Aerospace Sector Primer
Delivery rates and the aftermarket annuity are the inputs. This primer takes them to a dual-rate sum-of-the-parts and an EV/EBITDA you can defend.
The Excel model is the primer's two dual-rate sum-of-the-parts builds live across 12 sheets: original equipment capitalised at a cyclical rate, the installed-base aftermarket at a lower annuity rate, summed to enterprise value. Change the delivery rate, the aftermarket dollars per unit or either discount rate and the value per share moves.
Frequently Asked Questions
- How much of GE Aerospace revenue is aftermarket or services?
- GE Aerospace reported Services at 71% of total company revenue in FY2025 (Equipment $12.2bn, Services $30.2bn). Inside the narrower Commercial Engines & Services (CES) business the split is 75% services, carrying a 26.6% operating margin. GE does not file a margin at the wider, 71%-of-everything scope, only the CES proxy.
- Why can't Boeing's services share be compared directly with TransDigm's aftermarket share?
- They measure different things. Boeing's 16% is the Services share of consolidated revenue, the Products/Services split the company files across its whole business. TransDigm's 31.8% is commercial aftermarket specifically, with commercial OEM (23.8%) and defence (42.6%) reported as separate lines. Line them up without stating the basis and the comparison looks tidier than it is.
- What share of Airbus revenue comes from services?
- Services were 11% of Commercial Aircraft segment external revenue in FY2025, against Platforms at 89%. Commercial Aircraft is one of three Airbus Group segments, alongside Helicopters and Defence and Space, so 11% describes the aircraft business alone; it says nothing about the wider group.
- Does a higher aftermarket share come with a higher margin?
- Where a margin at the same scope as the mix figure is actually filed, yes: Airbus Commercial Aircraft (11% services) sits with a 10.4% segment margin, Safran Propulsion (64.6% aftermarket) sits with 23.0%, and GE CES (75% services) sits with 26.6%. Boeing, TransDigm and Howmet do not file a margin at the same scope as their headline mix number, so that check cannot be run across all six.