OEM vs Aftermarket: Where Aerospace Makes Money
Why commercial aerospace margins split between loss-making original-equipment ramps and high-margin aftermarket, with FY2025 segment margins across six filers.
Educational analysis for professional use. This guide is not investment advice or a recommendation to buy or sell any security, and it is not personalised.
The First Sale Funds the Fleet; the Installed Base Funds the Margin
Commercial aerospace equity work starts with a business-model split, not a consolidated P&L. Original equipment (airframes, new engines, OEM parts) carries production ramps, certification and working capital. Aftermarket (spares, MRO, services, sole-source parts) monetises the fleet already in service. The structural gap shows up in filed segment margins before you open a DCF.
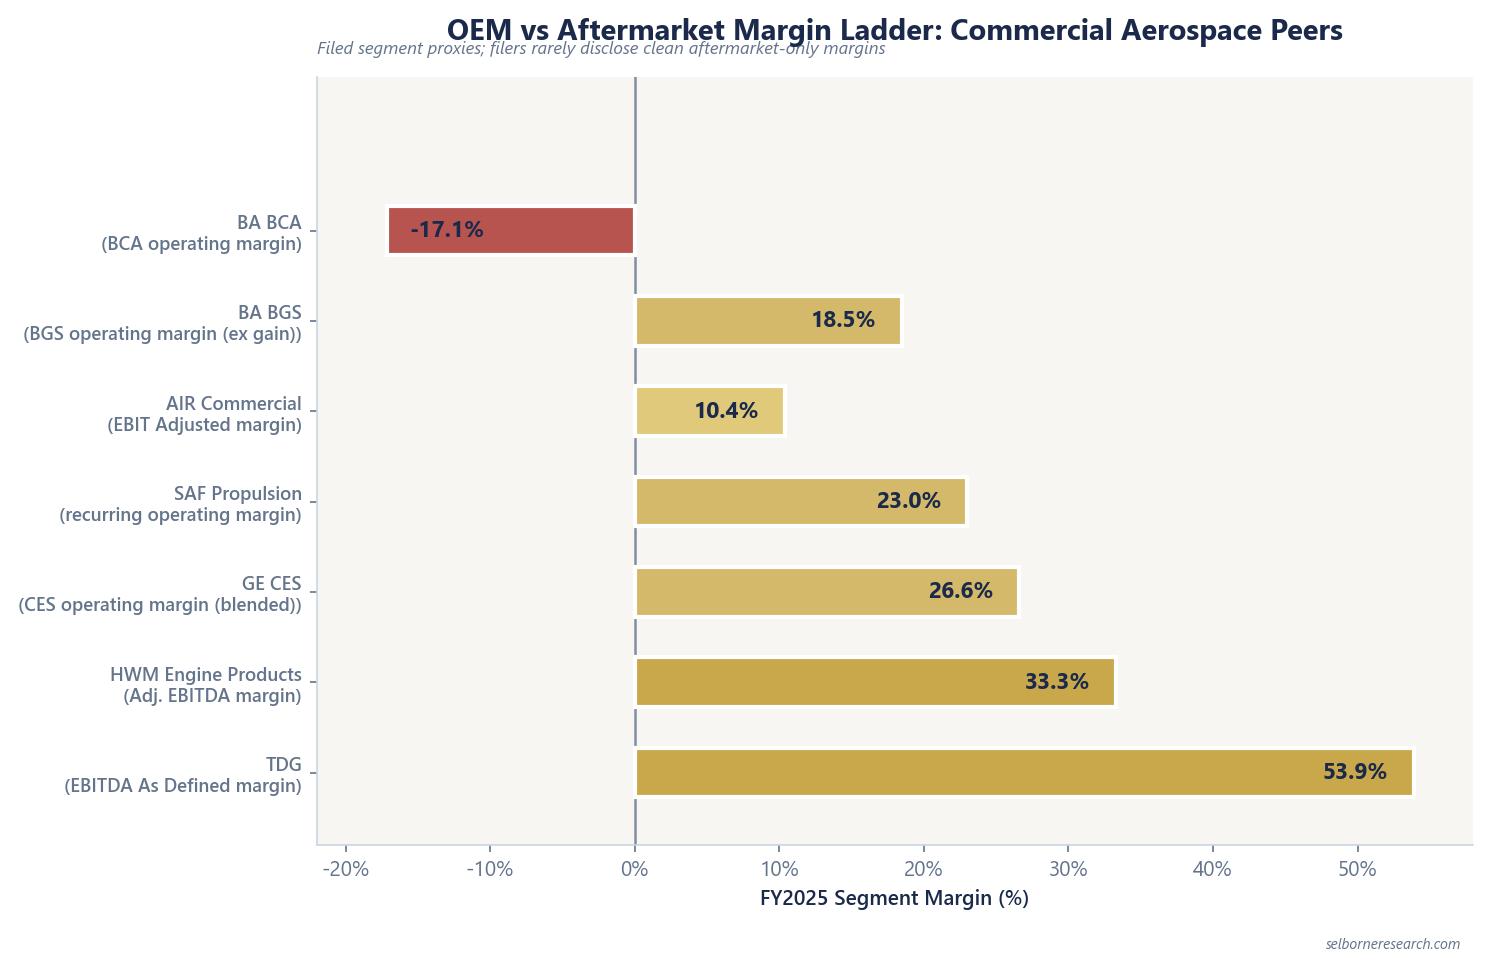
Boeing FY2025 is the blunt teaching case: Commercial Airplanes (BCA) ran a −17.1% operating margin on 600 deliveries while Global Services (BGS) printed ~18.5% ex a one-time Digital Aviation gain; the GAAP BGS margin was 64.4%, inflated by that gain. GE Aerospace’s Commercial Engines & Services (CES) business ran 75% services revenue at 26.6% CES operating margin. TransDigm’s EBITDA As Defined margin was 53.9% on proprietary aftermarket parts. Which side of the chain a name owns decides which of these two economics it reports.
Margin Rises With Distance from the Airframe
The pattern holds across the whole peer set, not just at Boeing: the closer a business sits to building the airframe itself, the thinner its margin. Filed segment margins (FY2025 unless noted):
| Segment | Margin | Basis |
|---|---|---|
| Boeing BCA | −17.1% | Operating margin |
| Boeing BGS | ~18.5% | Operating margin ex one-time gain |
| Airbus Commercial Aircraft | 10.4% | EBIT Adjusted (Platforms 89% / Services 11% mix) |
| Safran Propulsion | 23.0% | Recurring operating margin (OE 35.4% / aftermarket 64.6% revenue) |
| GE CES | 26.6% | Operating margin (Equipment 25% / Services 75%) |
| Howmet Engine Products | 33.3% | Adj. EBITDA margin (OE + spares blended) |
| TransDigm | 53.9% | EBITDA As Defined margin |
Airframers blend OE and a thin services line; engine and parts names sit at the top of the range because aftermarket mix dominates their revenue. Filers rarely disclose a clean aftermarket-only operating margin. Use the filed segment proxy and footnote the OE blend.
Boeing and Airbus Are Still Selling Mostly Hardware
Margin follows revenue mix. FY2025 filed splits:
| Company | OE / platforms | Aftermarket / services |
|---|---|---|
| Boeing (consolidated) | Products 84% | Services 16% |
| Airbus Commercial (external) | Platforms 89% | Services 11% |
| GE Aerospace | Equipment 29% | Services 71% |
| GE CES | Equipment 25% | Services 75% |
| Safran Propulsion | OE 35.4% | Aftermarket 64.6% |
| Howmet Aerospace | OE-heavy (~79% non-spares) | Spares ~21% |
| TransDigm | Commercial OEM 23.8% | Commercial aftermarket 31.8% (defence 42.6%) |
Boeing and Airbus remain OE-heavy on revenue even when aftermarket carries the margin story elsewhere in the group. GE, Safran and TransDigm tilt toward services or proprietary spares. Howmet is still OE-weighted on revenue with spares at ~21%, but commercial engine spares grew 44% YoY in FY2025.
Engine Makers Lose Money on the Sale to Win the Decades After
Engine OEMs price the first sale to lose money and make the difference back over the following twenty years of servicing. IATA/Oliver Wyman (Reviving the Commercial Aircraft Supply Chain, Oct 2025) puts a number on that:
| Stage | Typical gross margin |
|---|---|
| Engine OEM manufacturing | −5% to +10% |
| Engine MRO | 20-35% |
| Initial list-price discount on engines | Up to 80%+ |
GE and Rolls-Royce commercial engine revenue was 74% and 66% MRO-weighted respectively in 2024 per the same report, recovered through shop visits, spare parts and long-term service agreements rather than the sale itself. That is why services make up ~90% of CES’s ~$170B backlog, within GE’s ~$190B total (Q4 2024 call).
We typically apply a ~15-25 pp aftermarket premium over OE on the same value chain as a teaching range. Boeing’s BCA/BGS spread (~36 pp) and the IATA ranges anchor that band; individual filers will land above or below depending on mix and ramp stage.
Boeing Carries Both Ends of the Chain; GE and TransDigm Sit at One End
Boeing is the one name here that shows both economics inside a single set of accounts: an airframe division losing money on the ramp, and a services division earning it back. The Boeing profile covers what is actually driving that airframe loss.
GE Aerospace sits almost entirely on the aftermarket side of the chain. The GE Aerospace profile covers the installed base of roughly 45,000 commercial engines that generates it.
TransDigm skips the OE trough altogether: its parts are sole-sourced onto aircraft already flying, which is how gross profit reaches 60.1%, the highest in this set. The TransDigm profile covers how that pricing model works without a traditional backlog.
Split the Chain Before You Model a Single Margin
- Map revenue mix (OE vs aftermarket) before applying a single consolidated margin.
- Use filed segment margins as proxies; flag when GAAP is distorted (Boeing BGS ex gain).
- For engine names, cross-check services mix against CES/backlog services share (~90% at GE).
- Apply a ~15-25 pp aftermarket premium as an illustrative range when normalising ramp-trough OEM earnings.
- Tie mix to valuation bands in the installed-base guide and backlog ramp guide: OE-heavy names need rate and backlog screens; aftermarket-heavy names need installed-base and FCF conversion screens.
Consolidated EBIT at an airframer mid-ramp tells you almost nothing about steady-state economics. Split the chain first.
Commercial Aerospace Sector Primer
Delivery rates and the aftermarket annuity are the inputs. This primer takes them to a dual-rate sum-of-the-parts and an EV/EBITDA you can defend.
The Excel model is the primer's two dual-rate sum-of-the-parts builds live across 12 sheets: original equipment capitalised at a cyclical rate, the installed-base aftermarket at a lower annuity rate, summed to enterprise value. Change the delivery rate, the aftermarket dollars per unit or either discount rate and the value per share moves.
Frequently Asked Questions
- Why do aerospace OEM margins trail aftermarket margins?
- Original equipment carries ramp costs, certification spend and list-price discounts on airframes and engines. Aftermarket monetises the installed fleet through spares, MRO and long-term service agreements at higher realised pricing. IATA/Oliver Wyman (Oct 2025) puts engine OEM manufacturing gross margins at −5% to +10% versus engine MRO at 20-35%. Boeing FY2025 filed the split starkly: Commercial Airplanes −17.1% operating margin versus Global Services ~18.5% ex one-time gain.
- How much of GE Aerospace revenue is aftermarket?
- GE Aerospace reported Equipment 29% and Services 71% of FY2025 revenue. Within Commercial Engines & Services (CES), the mix was Equipment 25% and Services 75%. CES operating margin was 26.6% on the blended segment. GE does not file a clean services-only margin; CES blended margin is the standard proxy.
- What is the aftermarket margin premium in commercial aerospace?
- A working convention bands the aftermarket premium at ~15-25 percentage points above OE on the same value chain. Two anchors support that band: Boeing's BCA-to-BGS spread runs about 36 points (−17.1% versus ~18.5%), and IATA's engine range runs −5% to +10% at OEM manufacturing against 20-35% at MRO. Filed segment margins stand in as the proxy, because few filers split out an aftermarket-only operating profit line.
- How do list-price discounts shift profit to the installed base?
- IATA/Oliver Wyman documents engine initial list-price discounts up to 80%+ on new equipment. Programme-level net airframe transaction pricing is not filed per order. Profitability on the first sale is often negative or thin; engine and parts suppliers recoup economics through decades of spares, shop visits and long-term service agreement (LTSA) cash flows on the installed base.