Backlog and the Narrowbody Ramp
How to derive aircraft backlog-years and book-to-bill from filed orders and deliveries, and read them against production-rate targets for the narrowbody ramp.
Educational analysis for professional use. This guide is not investment advice or a recommendation to buy or sell any security, and it is not personalised.
Backlog-Years Tell You How Long the Ramp Runs
Aircraft OEM equity work hinges on two linked stocks: firm order backlog (units and dollar value) and the production rate converting that backlog into deliveries. Backlog-years bridges them: undelivered firm orders divided by annual deliveries. It is always derived, never OEM headline guidance. Analysts compute it to sanity-check whether stated monthly rates can clear the order book inside a credible horizon.
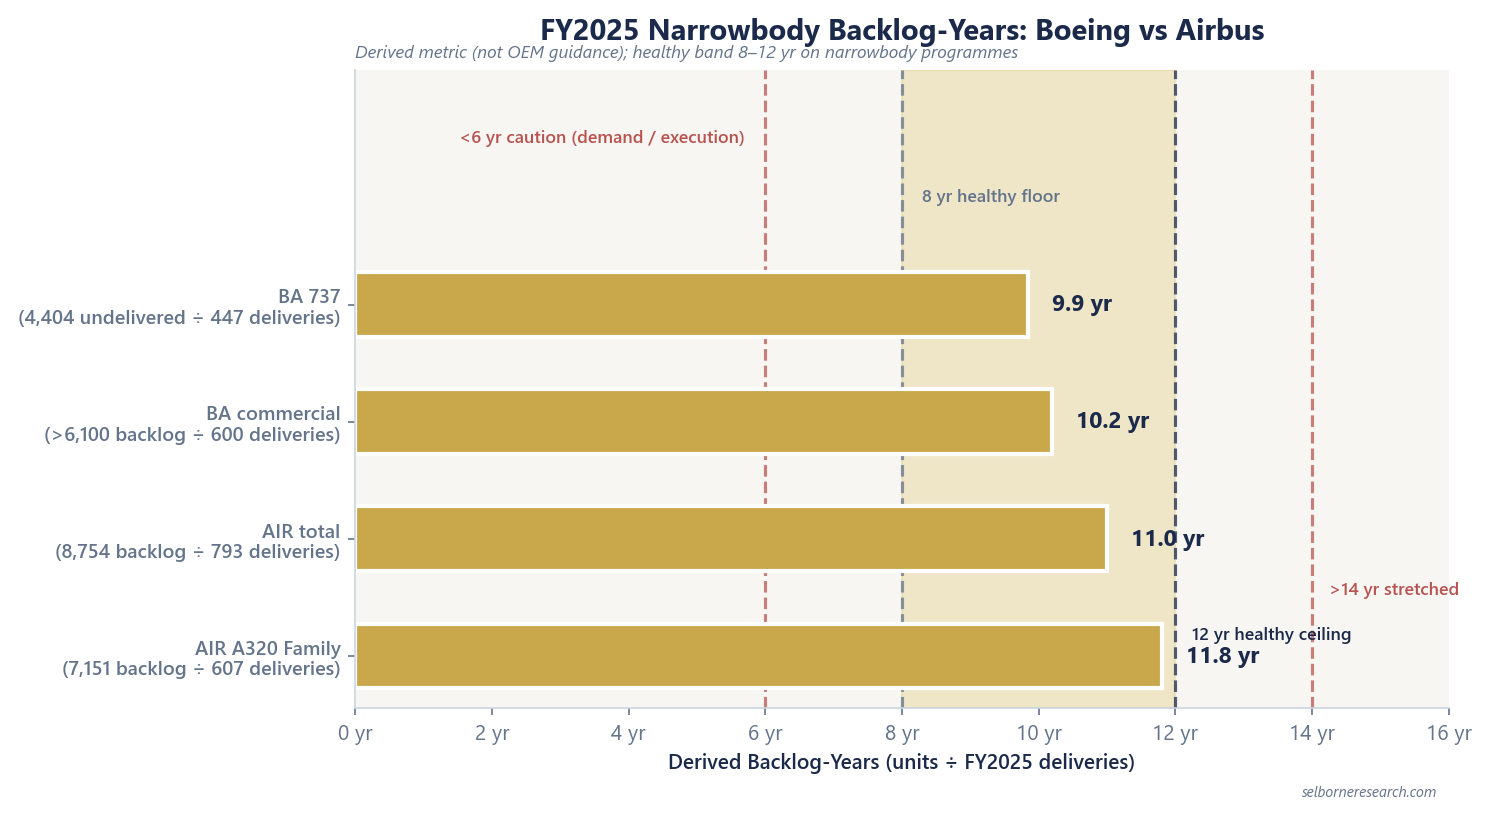
FY2025 narrowbody maths from filed data: Boeing 737 ~9.9 years (4,404 undelivered firm orders ÷ 447 deliveries); Airbus A320 Family ~11.8 years (7,151 backlog ÷ 607 deliveries). Both sit inside our 8-12 year healthy screening range on narrowbody programmes.
FY2025 Backlog and Delivery Snapshot
| Metric | Boeing | Airbus |
|---|---|---|
| Commercial backlog (units) | >6,100 aircraft | 8,754 aircraft |
| BCA / commercial order book (value) | $567.3B | €539.7B (commercial division) |
| FY2025 deliveries | 600 (737: 447) | 793 (A320 Family: 607) |
| Derived total backlog-years | ~10.2 yr | ~11.0 yr |
| Derived narrowbody backlog-years | 737: ~9.9 yr | A320 Family: ~11.8 yr |
| FY2025 book-to-bill (commercial units) | ~1.96× | ~1.12× |
| Production-rate target | 737: 42/month (Q4 2025) | A320: 70-75/month by end-2027 |
Boeing’s unit book-to-bill is the strongest in the peer set; Airbus runs a larger absolute backlog with a lower but still healthy ratio above 1.0. Dollar book-to-bill is not disclosed by Boeing; Airbus files company-wide value book-to-bill above 1.
Backlog-Years Screen
Screening bands for derived backlog-years on narrowbody programmes:
| Band | Years | Read |
|---|---|---|
| Caution | <6 yr | Demand or execution gap |
| Healthy | 8-12 yr | BA and AIR FY2025 points sit here |
| Stretched | >14 yr | Delivery-credibility risk |
Both FY2025 points computed above sit inside that band. That says nothing about near-term execution: rate ramps, supplier bottlenecks and certification caps still govern how fast the backlog actually clears. Backlog-years is a stock measure; book-to-bill, below, is the flow check.
Book-to-Bill: Orders Versus Deliveries
Book-to-bill is net orders (or order intake) divided by deliveries in the period. Definitions differ by filer; use the same numerator and denominator the company uses.
| Company | FY2025 ratio | Computation |
|---|---|---|
| Boeing (commercial units) | ~1.96× | 1,173 net orders ÷ 600 deliveries |
| Airbus (commercial units) | ~1.12× | 889 net orders ÷ 793 deliveries |
| GE Aerospace | ~1.44× | $66.2B orders ÷ $45.855B revenue |
We screen book-to-bill at <0.95 contracting; 0.95-1.05 steady; >1.05 growth; above 1.0 healthy. All three computed commercial peers exceed 1.0 in FY2025. Safran and Howmet do not disclose group book-to-bill in primary filings.
Production-Rate Ramp
Monthly production rate is the conversion lever linking backlog to revenue:
| Programme | FY2025 rate / target | Source basis |
|---|---|---|
| Boeing 737 | 42/month (end Q4 2025) | FY2025 earnings release |
| Boeing 787 | Transitioning to 8/month | FY2025 release |
| Airbus A320 Family | 70-75/month by end-2027; stabilise 75 | Feb 2026 outlook |
| Safran LEAP | 1,802 deliveries FY2025; FY2026 plan ~+15% | FY2025 results |
Rate increases pull forward revenue, but they pull forward working capital, supplier stress and quality oversight with it. Boeing’s climb follows a prolonged production trough; Airbus is scaling from an already larger delivery base.
Engine Backlog Follows the Airframe Ramp
Safran does not file a LEAP order backlog in units, so the FY2025 delivery count shown above is the only public throughput signal, and CFM/LEAP volumes move with Airbus A320neo and Boeing 737 MAX output rather than any figure Safran discloses directly. The Safran profile covers Propulsion aftermarket at 64.6% of revenue and 23.0% recurring operating margin, the engine side of the same ramp.
Where This Shows Up in Filings
Boeing’s FY2025 FCF was ($1.9B), negative even with deliveries running at the pace shown above: that is the production-trough case worked through in the Boeing profile.
Airbus’s FY2025 FCF was €4.8B, with €12.2B net cash and a 10.4% Commercial Aircraft EBIT Adjusted margin: the same ramp, from a stronger starting balance sheet, in the Airbus profile.
The duopoly guide covers why Boeing plus Airbus still control 86% of 2024 global deliveries and why certification barriers sustain the order concentration you see in these backlog tables.
Building the Ramp in a Model
- Pull backlog units and deliveries from the same fiscal period before computing backlog-years.
- Label backlog-years derived; do not present as management guidance.
- Cross-check book-to-bill above 1.0 against backlog unit growth year-on-year.
- Layer stated monthly rate targets and sensitivity on supplier/quality delays.
- For engine suppliers, map LEAP or CFM delivery growth to airframe delivery guidance.
Backlog without rate is a static headline. Rate without book-to-bill tells you nothing about whether the order book is still building.
Commercial Aerospace Sector Primer
Delivery rates and the aftermarket annuity are the inputs. This primer takes them to a dual-rate sum-of-the-parts and an EV/EBITDA you can defend.
The Excel model is the primer's two dual-rate sum-of-the-parts builds live across 12 sheets: original equipment capitalised at a cyclical rate, the installed-base aftermarket at a lower annuity rate, summed to enterprise value. Change the delivery rate, the aftermarket dollars per unit or either discount rate and the value per share moves.
Frequently Asked Questions
- How do you calculate aircraft backlog-years?
- Backlog-years is a derived metric: undelivered firm orders (units) divided by annual deliveries in the same period. Boeing 737: 4,404 undelivered firm orders ÷ 447 FY2025 deliveries = ~9.9 years. Airbus A320 Family: 7,151 backlog ÷ 607 deliveries = ~11.8 years. OEMs publish backlog units and delivery counts; they do not publish headline backlog-years as official guidance.
- What is a healthy backlog-years range for narrowbody programmes?
- A working convention treats 8-12 years as healthy on narrowbody programmes. Below 6 years signals demand or execution gap risk; above 14 years raises delivery-credibility risk. The FY2025 derived points sit inside the healthy band: Boeing 737 ~9.9 yr, Airbus A320 Family ~11.8 yr.
- What production rates are Boeing and Airbus targeting?
- Boeing reached 737 production at 42/month by end Q4 2025. Airbus targets A320 Family production at 70-75/month by end-2027, stabilising at 75/month. Safran delivered 1,802 LEAP engines in FY2025 (+28% YoY) with a FY2026 plan of roughly +15%. Rate targets link backlog conversion to near-term revenue and working capital.
- What were FY2025 book-to-bill ratios for Boeing and Airbus?
- Boeing commercial units: 1,173 net orders ÷ 600 deliveries = ~1.96× (computed; not labelled in the filing). Airbus commercial units: 889 net orders ÷ 793 deliveries = ~1.12× (computed). A working convention treats above 1.0 as healthy; below 0.95 as contracting. Both commercial peers exceeded 1.0 in FY2025.