CET1 for European Banks: MDA Buffers vs the US
How the European capital stack resolves into the Maximum Distributable Amount trigger, and why distance to MDA is the European equivalent of US headroom.
Educational analysis for professional use. This guide is not investment advice or a recommendation to buy or sell any security, and it is not personalised.
The Same Ratio, a Different Question
Put a European bank and a US bank side by side at 13.0% CET1 and an analyst who stops there has learnt almost nothing. The ratio is built the same way in both places, capital over risk-weighted assets, but the thing it is measured against is not the same, and the consequence of running short is not the same either.
In Europe the requirement stack resolves into a single automatic trip-wire, the Maximum Distributable Amount trigger. Cross it and dividends, buybacks, AT1 coupons and discretionary bonuses are capped by formula. No supervisor has to decide anything. In the US the firm-specific element of the requirement comes out of the stress test and sits in a different place in the stack, which changes what a given ratio buys you.
So the European screen is not “how high is CET1”. It is distance to MDA, in basis points, and whether that distance is made of CET1 or of somebody else’s instruments. If you have already read our CET1 and bank capital ratios guide for the US stack, this is the same idea rebuilt for a jurisdiction that wired the restriction differently.
The European Stack, Bottom to Top
Order matters more than the total. Reading the layers from the bottom:
| Layer | What it is | Inside the MDA trigger? |
|---|---|---|
| Pillar 1 minimum | The Basel III floor, 4.5% CET1 of RWA, plus the Tier 1 and total capital minimums above it | Yes |
| Pillar 2 Requirement (P2R) | Firm-specific add-on set annually by the supervisor through its review of the bank’s own risk assessment. Binding | Yes |
| Combined buffer requirement (CBR) | Capital conservation buffer, countercyclical buffer, systemic buffers for globally or domestically important banks, and the systemic risk buffer where a national authority imposes one | Yes; this is the layer the restriction is graduated across |
| Pillar 2 Guidance (P2G) | The supervisor’s view of what the bank should hold on top, informed by stress testing. Not binding | No |
The MDA trigger sits at the top of the combined buffer requirement. Everything below it is hard. P2G, the layer that looks most like a US stress-test outcome, is the one layer that triggers nothing automatically: a bank that dips into P2G is in a conversation with its supervisor, not in a distribution freeze.
That split is the single most useful thing to know about European bank capital. A supervisor worried about a bank can express that worry as P2R, which raises the trip-wire, or as P2G, which does not. The headline CET1 ratio is silent on which it did.
How Hard the Restriction Bites
The combined buffer requirement is cut into four quartiles. The further into it a bank sits, the smaller the share of distributable profits it may pay out.
| Position within the CBR | Share of distributable profits payable |
|---|---|
| Top quartile | 60% |
| Second quartile | 40% |
| Third quartile | 20% |
| Bottom quartile | Nil |
The scale is set in the Capital Requirements Directive, Article 141. It applies to ordinary dividends, share buybacks, AT1 coupon payments and discretionary staff bonuses together, and the bank must file a capital conservation plan with its supervisor.
Two features of that design do real analytical work. First, AT1 coupons are inside the restriction, which is why European AT1 spreads move with distance to MDA rather than with the headline ratio; the coupon risk is a capital-stack question, not a credit question. Second, the cap is a share of distributable profits, so a bank whose earnings have collapsed has a small MDA even at a generous percentage. Weak profitability and a thin buffer compound.
AT1 and Tier 2 Shortfalls Move the Trigger
Distance to MDA is quoted in CET1 terms but it is not purely a CET1 story, and this is where screens go wrong.
The Pillar 2 Requirement can be met partly with Additional Tier 1 and Tier 2 instruments rather than entirely with common equity. If a bank has not issued enough AT1, or an outstanding instrument stops counting, the unfilled portion must be covered with CET1 instead. The MDA trigger rises accordingly.
The practical consequence: distance to MDA can shrink by tens of basis points while the CET1 ratio is unchanged, because a funding decision moved the trip-wire rather than the capital. Any bank that has been told the number is only comparable across a peer group if you have read the composition alongside it. European banks disclose the trigger and its build in the Pillar 3 report; take it from there rather than reconstructing it from the ratio.
Against the US Approach
The US stack reaches a similar place by a different route. The firm-specific layer is the Stress Capital Buffer, set from the supervisory stress test with a floor of 2.5%, sitting alongside the G-SIB surcharge inside the buffer that restricts distributions. There is no separate soft guidance layer above it.
| Europe | US | |
|---|---|---|
| Common floor | 4.5% CET1 Pillar 1 minimum | 4.5% CET1 minimum |
| Firm-specific supervisory add-on | P2R, below the buffers, binding | Stress Capital Buffer, inside the buffer, floor 2.5% |
| Stress-test result lands in | P2G mostly, which is not binding | The Stress Capital Buffer, which is binding |
| Systemic add-on | G-SII and O-SII buffers, plus national systemic risk buffer | G-SIB surcharge, at least 1.0% if designated |
| Restriction | Automatic, quartile formula on distributable profits | Automatic, quartile formula on eligible retained income |
| What analysts screen | Distance to MDA | Headroom above the total requirement |
Both frameworks graduate the restriction across quartiles, so the mechanic is closer than the vocabulary suggests. The differences that matter are where the supervisor’s opinion lands, binding in the US, split between binding and non-binding in Europe, and what the payout cap is applied to. Europe caps a share of distributable profits under national company law; the US caps a share of eligible retained income, broadly trailing four-quarter net income net of distributions. A European bank having a bad year has a small MDA. A US bank having a bad year has small eligible retained income. The route is different, the bite is comparable.
For calibration on the US side, verified total requirements effective 1 Oct 2025 ran from Wells Fargo at 8.5% to Citigroup at 11.6%, with JPMorgan at 11.5% and Bank of America at 10.0%. Against end-FY2025 ratios, that left JPMorgan +2.6 pp of headroom on its binding advanced ratio and Bank of America +1.4 pp. Those spreads, not the 14.1% and 11.4% ratios that produced them, are what a European distance-to-MDA figure should be compared against.
The Denominators Differ Too
Capital over risk-weighted assets only compares if the denominators are built alike, and they are not.
European banks have leaned harder on internal ratings-based models to set risk weights, US large banks on standardised calculations with a floor beneath any modelled result. Modelled risk weights on the same mortgage book can come out materially lower, which flatters the ratio without changing the loan. Basel’s output floor, phasing in through the current implementation round, limits how far modelled RWA may fall below the standardised calculation and narrows the gap over time. Until it has fully bitten, treat a European CET1 ratio as carrying more model dependence than a US one at the same level.
RWA density, risk-weighted assets over total assets, is the quick sanity check. A bank whose density sits well below peers with similar lending is either genuinely lower risk or running more aggressive models, and it is worth knowing which before you credit it with the capital.
Working the Distance
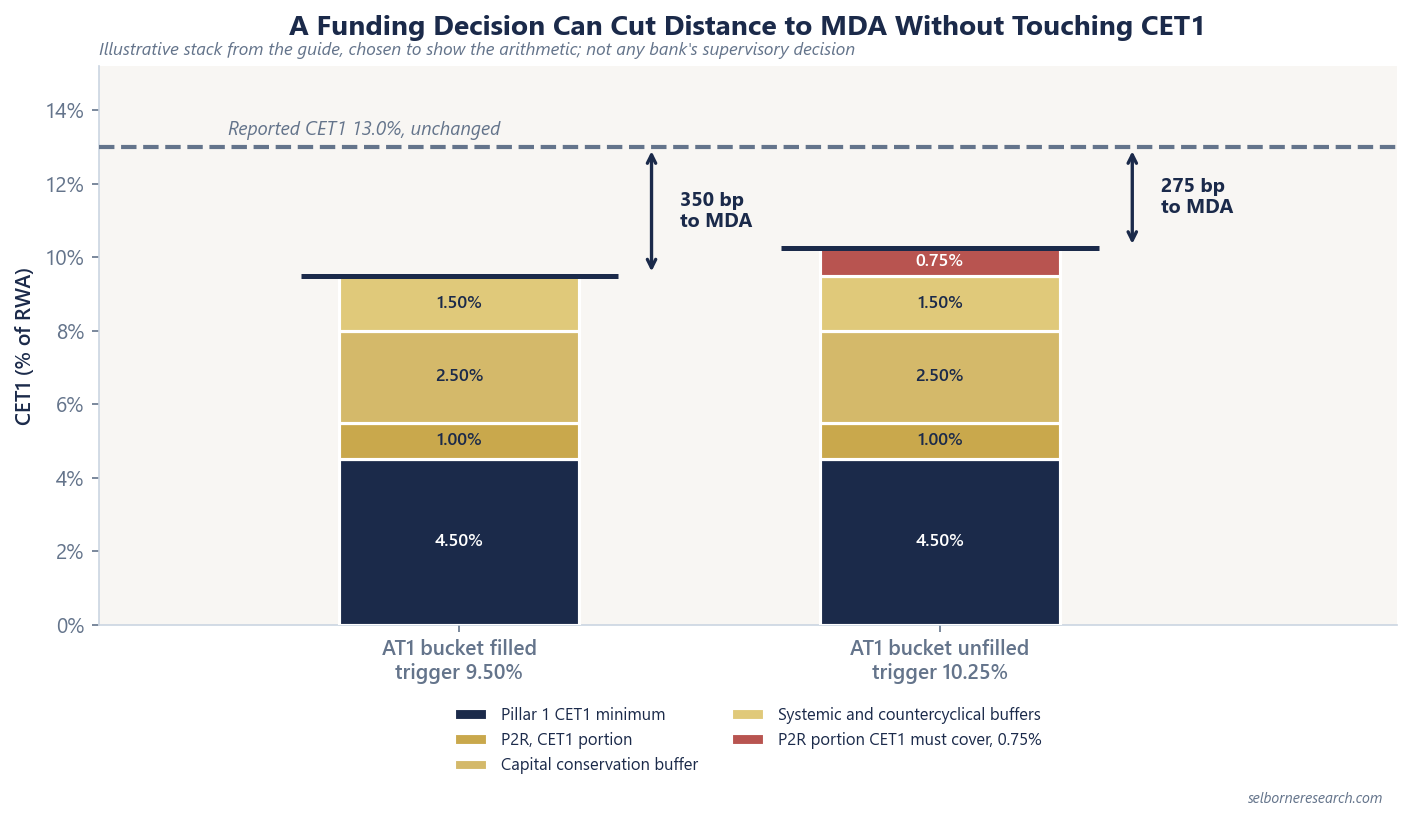
The layers below are real; the rates are chosen to show the arithmetic and are not taken from any bank’s supervisory decision.
| Layer | Rate |
|---|---|
| Pillar 1 CET1 minimum | 4.50% |
| P2R, CET1 portion | 1.00% |
| Capital conservation buffer | 2.50% |
| Systemic and countercyclical buffers | 1.50% |
| MDA trigger | 9.50% |
A bank reporting 13.0% CET1 against that stack has 350 bp of distance to MDA. Multiply by risk-weighted assets to get the money: on €300bn of RWA, 350 bp is €10.5bn of CET1 above the trip-wire.
Now change one thing. Suppose the bank’s P2R is 1.75% in total but only the 1.00% above is filled with CET1, and it cannot place the AT1 needed for the rest. The unfilled 0.75% must be met with CET1, the trigger moves to 10.25%, and distance to MDA falls to 275 bp, or €8.25bn. The reported CET1 ratio never moved. This is the failure mode a ratio-only screen misses.
Run the same walk forward that the US framework invites: retained earnings add to the numerator, dividends and buybacks subtract, RWA growth and rising charge-offs squeeze from both sides. Credit deterioration is the fast one, because provisions cut retained earnings while defaulted exposures push risk weights up. Our net charge-offs guide covers the leading indicator.
Where to Get the Number
Do not derive a European bank’s MDA trigger from its CET1 ratio and a guess at the buffers. Banks publish it. The Pillar 3 disclosure and the quarterly results pack state the CET1 requirement, the P2R and its CET1 portion, the combined buffer requirement and, usually, the distance to MDA in basis points. Supervisory decisions are republished each year and the trigger changes with them, so a figure carried over from last year is stale rather than approximately right.
We do not publish firm-specific European capital figures on this page. The stack teaches structurally and the trigger is bank-by-bank, dated, and disclosed by the bank itself; take it from the source and check its as-of date.
What This Changes in a Comparison
Screen on distance to MDA against US headroom, never on the raw ratios. Then ask the second question, which is what the distance is made of: a bank whose gap is thin because it is carrying an unfilled AT1 bucket has a financing problem it can fix in a week of decent primary market conditions. A bank whose gap is thin because provisions ate its retained earnings has something slower and worse.
Distribution capacity is the reason any of this reaches the equity story. A bank inside its buffers keeps only a fraction of its profits available to pay out, and none of it in the bottom quartile, so its returns accrue to the balance sheet whether or not that is where shareholders want them; the market marks it accordingly, which is the link back to P/TBV and ROTCE. For the US comparison set on verified capital and returns, see our JPMorgan Chase, Citigroup and Bank of America profiles.
Distance to MDA measures a distribution trigger, not a value. The primer carries it into a residual-income value on a tangible-book roll-forward.
The Excel model is the primer's three residual-income builds live across 12 sheets: change the margin, the credit charge or the cost of equity and the valuation moves.
Frequently Asked Questions
- What is the MDA buffer for a European bank?
- The Maximum Distributable Amount (MDA) trigger is the CET1 level at which a European bank stops being free to pay dividends, buy back shares, pay AT1 coupons and pay discretionary bonuses. It sits at the top of the requirement stack: Pillar 1 minimum, plus the firm-specific Pillar 2 Requirement, plus the combined buffer requirement. Fall inside the combined buffer and the restriction applies automatically by formula, not by supervisory decision. The gap between reported CET1 and that trigger is the distance to MDA, and it is the number European bank analysts screen on.
- Is a European bank CET1 requirement comparable to a US one?
- Not directly. Both start from the same 4.5% Basel III CET1 minimum, but the firm-specific layer is built differently. In the US the firm-specific element is the Stress Capital Buffer, derived from the supervisory stress test and sitting inside the restriction-triggering buffer. In Europe the supervisor splits its firm-specific view in two: the Pillar 2 Requirement, which sits below the buffers and raises the MDA trigger, and Pillar 2 Guidance, which sits above the buffers and triggers nothing automatically. Two banks reporting the same CET1 ratio can therefore have very different distributable capacity.
- What happens if a bank breaches its MDA trigger?
- The combined buffer requirement is divided into four quartiles. The deeper into the buffer a bank sits, the smaller the share of its distributable profits it may pay out, running from 60% in the top quartile down to nothing in the bottom. The bank must also submit a capital conservation plan to its supervisor. The restriction covers AT1 coupons alongside ordinary dividends, which is why European AT1 instruments are priced off distance to MDA rather than off the headline CET1 ratio.
- Why can an AT1 shortfall reduce a bank’s distance to MDA?
- The Pillar 2 Requirement can be met partly with Additional Tier 1 and Tier 2 instruments, not only with CET1. If a bank cannot fill those buckets, whether because it has not issued enough or because an instrument has become ineligible, the gap has to be plugged with CET1. That lifts the CET1 level at which the MDA trigger sits, so distance to MDA can shrink without the CET1 ratio moving at all. Read the Pillar 3 disclosure for the composition, not just the ratio.