CET1 Requirements 2026: SCB and G-SIB Surcharges
How a US bank's CET1 requirement is assembled from the 4.5% minimum, the Stress Capital Buffer and the G-SIB surcharge, and why headroom is what to screen on.
Educational analysis for professional use. This guide is not investment advice or a recommendation to buy or sell any security, and it is not personalised.
Two Banks, the Same Ratio, Different Positions
There is no single CET1 requirement for US banks. Each large bank is handed its own number, built from three layers, and two of those layers are reset annually by the regulator. A bank reporting 11% CET1 against a 7% requirement is in a comfortable position. A bank reporting the same 11% against a 10.5% requirement is nearly out of room. The ratio looks identical; the capital position is not.
That is why the screening number is headroom, reported CET1 minus the firm’s own total requirement, and not the ratio itself. This guide covers how the requirement is assembled and how the pieces move. For the definition of CET1 capital and risk-weighted assets, and the buffer screen we apply to headroom, see our CET1 and bank capital ratios guide.
The Requirement Is Assembled, Not Set
Think of it as three stacked layers, each set by a different process on a different clock.
| Layer | Applies to | Set by | Resets |
|---|---|---|---|
| CET1 minimum, 4.5% of RWA | Every bank | The US adoption of Basel III | Fixed; changes only if the rule changes |
| Stress Capital Buffer, floor 2.5% | Large banks in the Fed’s stress-test population | The Fed’s annual supervisory stress test | Annually, effective 1 October |
| G-SIB surcharge, at least 1.0% | The banks designated globally systemically important | Annual scoring of the firm’s systemic footprint | Annually, phased in after the score is published |
The total requirement is the sum. Falling below it does not mean the bank has failed; it means dividends and buybacks are restricted on a sliding scale, tightening as the shortfall grows. That is the practical reason headroom matters to an equity holder: it is the regulator’s permission to hand cash back.
Only the first layer is common to everyone. The other two are what create the spread between banks, and both are, to some degree, managed variables rather than facts of nature.
Where the Stress Capital Buffer Comes From
The SCB is not a judgement on the balance sheet as it stands. It is a judgement on how that balance sheet behaves in a modelled recession.
The Fed runs the firm’s portfolio through a severely adverse scenario and projects the path of its CET1 ratio. The buffer reflects the peak-to-trough decline in that projected ratio, plus the common dividends the firm plans to pay over the following year, and it cannot fall below 2.5%. Most large banks sit at that floor, which tells you the modelled drawdown was smaller than 2.5 pp and the floor is doing the binding.
When a bank sits above the floor, the gap is information. Citigroup’s SCB of 3.6% effective 1 Oct 2025 is 1.1 pp above the floor: the Fed’s model puts a deeper capital hole in that mix of trading, cards and emerging-market exposure than in a deposit-and-mortgage franchise. The bank is not being penalised for weakness today; it is being charged for the shape of its losses in a downturn.
Two consequences for anyone modelling forward. A bank can pass the test and still see its requirement rise, because the scenario changes each year. And the SCB is partly under management control, because it responds to business mix: shrinking a loss-heavy book, or cutting the planned dividend, lowers the buffer over time. When you build a capital forecast, forecast the requirement as well as the ratio.
The G-SIB Surcharge Is a Price on Size
The surcharge exists to make being systemically important expensive. A firm is scored on its size, how interconnected it is with the rest of the financial system, how complex it is, how much of its activity crosses borders, and how much it depends on short-term wholesale funding. Two scoring methods run in parallel, one closer to the international Basel approach and one that leans harder on wholesale funding; US firms carry the higher of the two. Score high enough and the surcharge steps up a bracket.
The size of this layer dwarfs the variation in the other two. JPMorgan’s surcharge of 4.5% against Wells Fargo’s 1.5% is a 3 pp difference in required capital on every dollar of risk-weighted assets, which is far more than any plausible gap in their stress-test outcomes. Both carry a 2.5% SCB. The entire gap between an 11.5% requirement and an 8.5% one is scale and complexity.
Banks that are not designated carry no surcharge at all. That is the single biggest reason super-regional requirements start near 7% while money-centre requirements start near 10%, and it is what makes cross-tier comparisons of the raw ratio misleading.
Requirements by Bank
Fed large-bank capital requirements, effective 1 Oct 2025:
| Bank | Minimum | SCB | G-SIB surcharge | Total requirement |
|---|---|---|---|---|
| Citigroup | 4.5% | 3.6% | 3.5% | 11.6% |
| JPMorgan Chase | 4.5% | 2.5% | 4.5% | 11.5% |
| Bank of America | 4.5% | 2.5% | 3.0% | 10.0% |
| Wells Fargo | 4.5% | 2.5% | 1.5% | 8.5% |
| US Bancorp | 4.5% | 2.6% | None | 7.1% |
| PNC Financial | 4.5% | 2.5% | None | 7.0% |
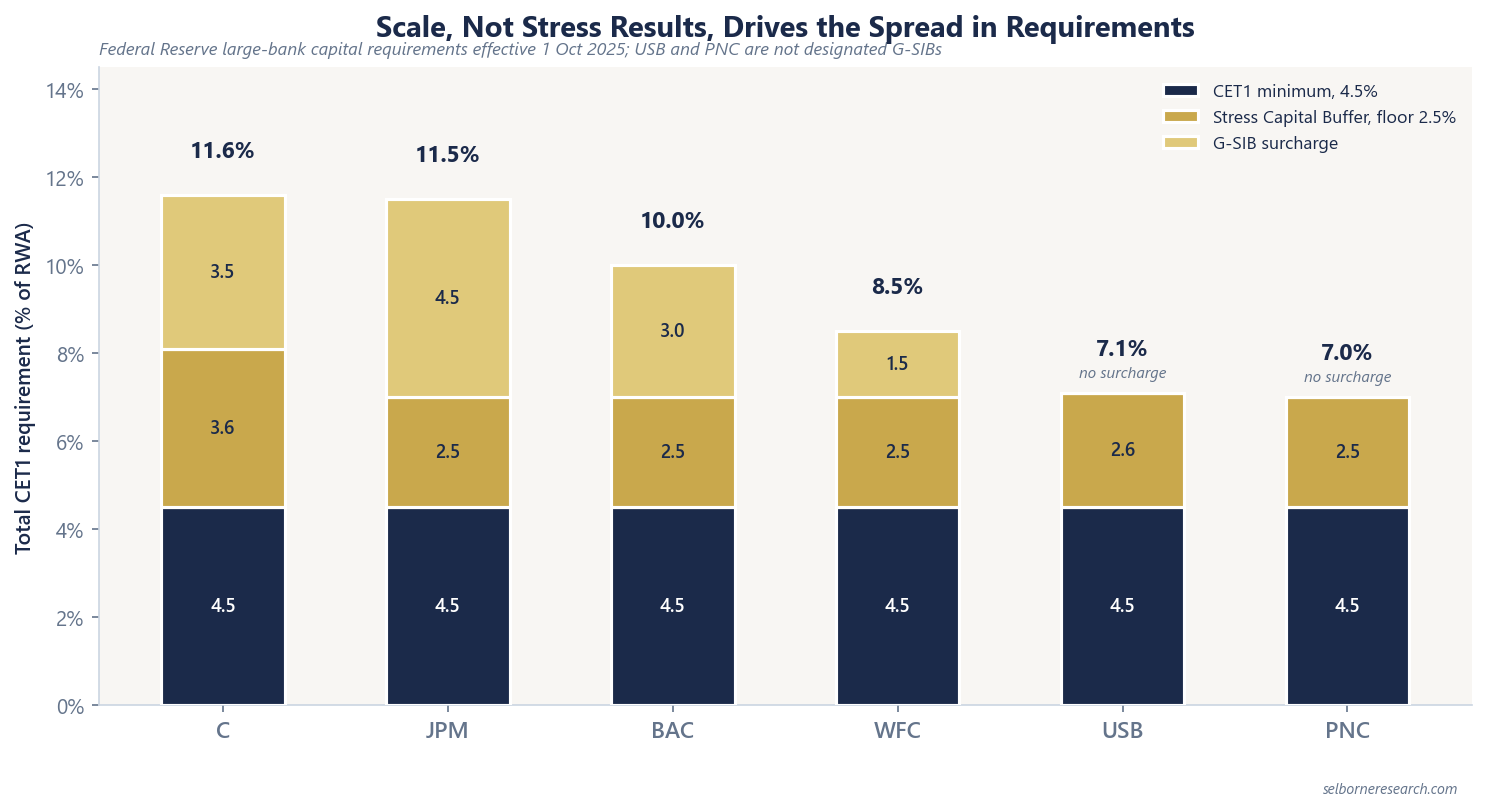
Read the columns rather than the total. Citigroup and JPMorgan land within 0.1 pp of each other, but for opposite reasons: Citi through a stress result above the floor, JPMorgan through the largest surcharge in the group. Those two requirements will not move together, because the drivers behind them do not.
These figures hold until the next reset. Refresh the SCB from the Fed’s annual publication each autumn and the surcharge when new scores are phased in; a requirement carried over from a prior year is a stale input, not a constant.
Headroom Reorders the League Table
Once you subtract each bank’s own requirement, the ranking on capital strength barely resembles the ranking on the ratio.
| Bank | CET1, end-FY2025 | Requirement | Headroom | Rank by ratio | Rank by headroom |
|---|---|---|---|---|---|
| US Bancorp | 10.8% | 7.1% | +3.7 pp | 4 | 1 |
| PNC Financial | 10.6% | 7.0% | +3.6 pp | 6 | 2 |
| JPMorgan Chase | 14.1% (Advanced, binding) | 11.5% | +2.6 pp | 1 | 3 |
| Wells Fargo | 10.61% | 8.5% | +2.1 pp | 5 | 4 |
| Citigroup | 13.2% | 11.6% | +1.6 pp | 2 | 5 |
| Bank of America | 11.4% | 10.0% | +1.4 pp | 3 | 6 |
The inversion is close to complete. Citigroup reports 2.6 pp more CET1 than Wells Fargo and has half a point less room above its own requirement. US Bancorp reports the fourth-highest ratio in the set and holds the widest gap above what it is obliged to hold. Screening these six on the raw ratio would have picked out Citigroup and passed over the two regionals; screening on headroom does the reverse.
JPMorgan’s headline ratio is the Standardised 14.6%, but it also has to clear the same requirement on the Advanced approach, where it reported 14.1% at year-end. The lower one binds, so the row above uses 14.1%. PNC’s ratio was labelled an estimate at the fourth-quarter release. Compare like with like: use whichever approach binds, and take the audited figure when it lands.
Three Caveats Before You Trust the Gap
Headroom is the right screening number, not a complete answer. Three things sit between it and a conclusion.
Management targets sit above the requirement. No bank runs at its regulatory floor. Boards hold an internal cushion for stress-test volatility, acquisitions and mark-to-market swings, so the capital genuinely available for distribution is headroom minus that cushion, and the cushion is disclosed inconsistently.
Comparability across tiers is imperfect. Firms below the G-SIB tier may elect to keep most unrealised securities gains and losses out of CET1, an election the largest banks do not have. A regional’s ratio can therefore be less sensitive to rate moves than a G-SIB’s on identical securities books, which flatters the comparison in a selloff and penalises it in a rally.
Both sides of the gap move. The ratio moves with retained earnings, buybacks and RWA growth. The requirement normally resets each autumn with the stress test, so a bank can widen its headroom all year and lose it in a single reset. Not at the moment, though: the Fed froze stress capital buffers in February 2026 while it reworks its stress models, and the frozen buffers hold to September 2027. Until then the requirement side is still and only the ratio moves.
What Headroom Buys, and What Erodes It
Headroom converts to a distribution decision through simple arithmetic: multiply the gap in percentage points by risk-weighted assets to get the dollar capital sitting above the requirement. That is the pool the bank can pay out, shrink into, or absorb losses with before restrictions bite.
Credit is what usually takes it away, and it takes it from both directions at once: charge-offs reduce retained earnings while deteriorating credit pushes risk weights up. Our net charge-offs guide sets out the leading indicator to watch.
The valuation link runs through the same channel. A bank with genuine headroom can buy back stock, spreading the same earnings over fewer shares; above tangible book that raises ROTCE at the cost of tangible book per share, since each retired share costs more than its book. A bank without headroom must retain earnings whatever its returns look like, and the market tends to cap the multiple accordingly. That mechanism is covered in our P/TBV vs ROTCE guide.
For company-level capital and return detail on the names at either end of the headroom table, see our US Bancorp, JPMorgan Chase and Citigroup profiles.
What Matters Most
Never compare CET1 ratios without the requirements beside them. Build each bank’s number from the three layers, work out which layer is doing the driving, and take the difference. Then ask the forward question the ratio cannot answer: will next year’s stress test and next year’s earnings widen this gap or close it?
Headroom reorders the league table but leaves every bank unpriced. The primer takes that ranking through to a justified price-to-tangible-book.
The Excel model is the primer's three residual-income builds live across 12 sheets: change the margin, the credit charge or the cost of equity and the valuation moves.
Frequently Asked Questions
- How is a US bank’s CET1 requirement calculated?
- Three layers add together. Every bank carries the 4.5% Basel III minimum. Large banks add a firm-specific Stress Capital Buffer set by the Federal Reserve’s annual stress test, floored at 2.5%. Globally systemically important banks add a G-SIB surcharge of at least 1.0% on top. The sum is the total CET1 requirement, and it differs by bank: on the Fed’s requirements effective 1 Oct 2025, JPMorgan sits at 11.5% (4.5 + 2.5 + 4.5), Citigroup 11.6% (4.5 + 3.6 + 3.5), Bank of America 10.0%, Wells Fargo 8.5%, US Bancorp 7.1% and PNC 7.0%.
- What is the Stress Capital Buffer (SCB)?
- The SCB is the bank-specific layer set by the Fed’s annual stress test. It reflects how much CET1 the bank loses from peak to trough under the severely adverse scenario, plus the common dividends it plans to pay over the following year, subject to a 2.5% floor. Most large banks sit at the floor. A higher SCB, such as Citigroup’s 3.6% effective 1 Oct 2025, says the Fed’s model puts a deeper capital drawdown on that business mix, not that the bank is currently weak.
- Why is JPMorgan’s CET1 requirement higher than Wells Fargo’s?
- Almost entirely the G-SIB surcharge. Both carry the 4.5% minimum and a 2.5% SCB, but JPMorgan’s surcharge is 4.5% against Wells Fargo’s 1.5%, giving requirements of 11.5% and 8.5% effective 1 Oct 2025. The surcharge is scored on size, interconnectedness, complexity, cross-jurisdictional activity and funding profile, so scale and trading complexity are charged for directly.
- Is a higher CET1 ratio always better capitalised?
- No, because the requirement moves with the bank. On end-FY2025 figures, US Bancorp reported 10.8% CET1 against a 7.1% requirement, giving +3.7 pp of headroom, while Bank of America reported a higher 11.4% ratio against a 10.0% requirement, leaving +1.4 pp. Rank the comp set on headroom, not on the raw ratio, and check the comparability caveats before treating a regional’s ratio as equivalent to a G-SIB’s.