Float and the Investment-Income Engine
Berkshire float economics, verified FY2025 net investment income and book yields across six insurers, and the label traps that make raw yields incomparable.
Educational analysis for professional use. This guide is not investment advice or a recommendation to buy or sell any security, and it is not personalised.
Float Is Borrowed Money at an Unusual Price
Premiums arrive before claims leave. The gap is float: money the insurer holds and invests. It is not the insurer’s money. Every dollar of it is owed to a policyholder on a claim nobody has settled yet, and it sits on the balance sheet as a liability, so float is borrowed funding rather than capital.
What makes it unusual is the price. Warren Buffett’s cost-of-float framework asks what the insurer paid to borrow it, and the answer is the underwriting result. Underwriting profit means float is better than free, because the lender paid the borrower. Break-even underwriting means float is free. An underwriting loss means float is expensive, and the combined ratio tells you how expensive.
Float does not replace underwriting discipline. It amplifies it. A combined ratio below 100% earns an underwriting profit and leaves the insurer funding its bond portfolio at less than nothing. That is why Chubb at 85.7% combined ratio and 5.1% fixed-income book yield compounds differently than a 98% underwriter with the same portfolio: both make money, but only one is being paid to borrow.
FY2025 Net Investment Income (Filed)
| Company | FY2025 NII (primary basis) | Portfolio yield (label) | Yield value |
|---|---|---|---|
| MetLife | $22,559M GAAP; $21,432M adjusted | Total investment income yield | 4.91% |
| Prudential | $18,938M adjusted operating; $21,473M GAAP | GA subtotal yield | 4.32% |
| Chubb | $6,947M adjusted pre-tax; $6,465M pre-tax | Fixed income book yield | 5.1% |
| AIG | $4,215M GAAP; $3,778M APTI | GI FMS-AFS + loans book yield | 4.43% |
| Travelers | $3,959M pre-tax; $3,254M after-tax | After-tax total portfolio | 3.1% |
| Progressive | $3,549M | Pretax book; FTE total portfolio | 4.1% / 7.3% FTE |
Six different bases. Chubb’s 5.1% is fixed-income book yield. Progressive’s 7.3% is FTE total portfolio, not comparable to Travelers’ 3.1% after-tax total portfolio without adjustment. AIG’s 4.43% covers GI FMS-AFS and mortgage/other loans, not a consolidated all-asset headline.
The Label Trap
Before ranking yields, read the footnote:
- Chubb: average book yield on fixed income investments (pre-tax, fixed-income scope).
- Progressive: 4.1% pretax annualised book yield; 7.3% FTE total portfolio (tax-adjusted upward).
- Travelers: 3.1% after-tax total portfolio yield (tax-adjusted downward).
- AIG: 4.43% normalised annualised yield on GI FMS-AFS plus mortgage/other loans.
- MetLife: 4.91% total investment income yield on consolidated general account.
- Prudential: 4.32% general-account subtotal yield after investment expenses; 4.49% gross.
Mixing Progressive’s 7.3% FTE with Travelers’ 3.1% after-tax will rank the wrong company on investment skill.
ROE Decomposition
Total ROE blends two engines:
- Underwriting margin × premium leverage on equity
- Investment yield × investment leverage on equity
A P&C insurer earning a 10% underwriting margin (90% combined ratio) on premiums and 4.5% pre-tax book yield on a float-heavy portfolio can land near 12–13% ROE even before buybacks. That is the teaching arithmetic behind names like Travelers (89.9% CR, 3.1% after-tax yield, 21.0% ROE): strong underwriting plus investment leverage on a large bond book.
Pair float economics with the P/BV vs ROE lens: the market capitalises the blended return on ex-AOCI book.
Rate Framing
Yield sensitivity in the worked example below runs off a 10-year Treasury at 4.50% and Fed funds at 3.00%, which are scenario anchors rather than forecasts.
Higher reinvestment rates lift book yields as maturities roll. Duration and asset mix determine speed: a short-duration personal-auto float portfolio reprices faster than a long-duration commercial-lines book. Life general-account portfolios (MetLife 4.91% yield, 115 bps spread) carry separate spread dynamics outside the P&C float frame.
Worked Example: Float × Yield to NII
The same illustrative P&C insurer used across these guides:
| Input | Value |
|---|---|
| Net earned premiums | $20,000m |
| Float | $30,000m, or 1.5× net earned premiums |
| Pre-tax book yield | 4.5% |
| Net investment income | $30,000m × 4.5% = $1,350m |
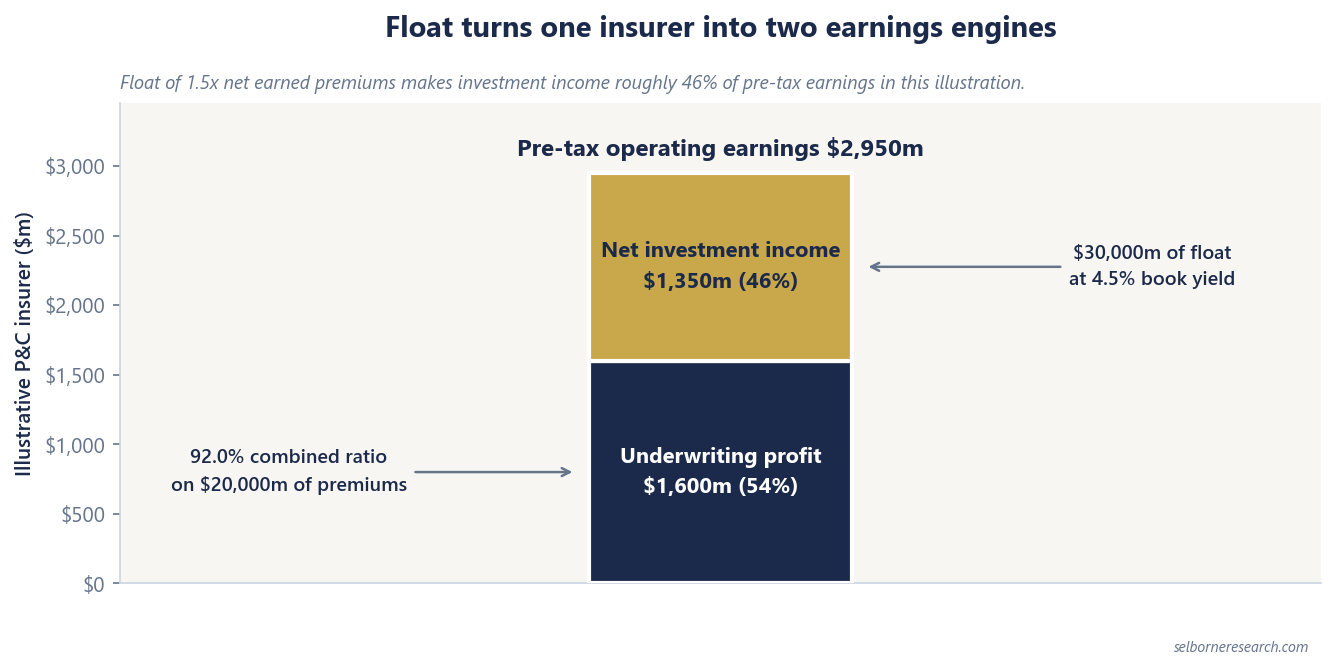
The 4.5% yield sits between Travelers’ 3.1% after-tax and Chubb’s 5.1% fixed-income book yield. Add the $1,600m underwriting profit from a 92.0% combined ratio (8% margin on $20,000m NEP) and pre-tax operating earnings reach $2,950m before tax. Investment income contributes ~46% of pre-tax earnings in this illustration, which is why yield basis labelling matters for peer comparison.
Life vs P&C Investment Engines
MetLife’s $22,559m GAAP net investment income on a general-account spread of 115 bps is a different machine than Chubb’s $6,465m pre-tax NII on P&C float. Life earnings depend on portfolio yield minus credited rates; P&C earnings pair underwriting margin with float-funded bond income. MetLife reports actuarial assumption review notables, not P&C-style calendar-year PYD.
What to Watch
Float economics reward underwriting discipline first and investment management second. Track net investment income growth, disclosed book yield on a consistent basis, and whether the combined ratio keeps float cheap. When yields converge across peers in a rising-rate environment, the separator returns to underwriting: the combined ratio ladder matters more, not less.
Float income shows what the portfolio earns and stops there. The primer turns it into an equity charge and a residual-income line.
The Excel model is the primer's three residual-income valuations live across 13 sheets: change the combined ratio, the spread or the cost of equity and the justified P/BV moves.
Frequently Asked Questions
- What is insurance float?
- Float is premium money held between receipt and claim payment. Berkshire Hathaway defines it as funds available for investment between when premiums are collected and when claims are paid. It is not surplus capital: the money is owed to policyholders and sits on the balance sheet as a liability, so float is borrowed funding whose cost is the underwriting result. Underwriting profit makes float "better than free"; break-even underwriting makes it free; an underwriting loss makes float costly.
- How does investment income contribute to insurer ROE?
- ROE decomposes into underwriting margin on equity plus investment yield on the investment portfolio (scaled by investment leverage). A P&C insurer with a 90% combined ratio earns 10% underwriting margin on premiums; net investment income on float and shareholders' capital adds a second return stream. The two engines sum to reported ROE.
- Why are insurer investment yields not directly comparable?
- Disclosure bases differ. Chubb reports 5.1% average book yield on fixed income. Progressive reports 4.1% pretax and 7.3% FTE total portfolio. Travelers reports 3.1% after-tax total portfolio. AIG reports 4.43% on GI FMS-AFS plus loans. Never rank raw yields without matching tax basis and asset scope.
- How do interest rates affect insurer investment income?
- Higher reinvestment rates lift book yields over time as maturing bonds roll into higher coupons. The effect is slow: a book yield is the average coupon on bonds already owned, so it moves only as maturities are reinvested. Float size and duration profile determine how quickly a change in rates flows through to net investment income.