Crack Spread Capture Rate: Comparing Refiners Properly
Capture is realised margin ÷ indicator. A filed 105% runs against the company's own benchmark; against a national crack, refiners keep about half.
Educational analysis for professional use. This guide is not investment advice or a recommendation to buy or sell any security, and it is not personalised.
A Capture Rate Means Nothing Without Its Denominator
Capture rate is realised refining margin divided by an indicator margin. The arithmetic is trivial. Almost all the difficulty is in which indicator, and getting that wrong is how a perfectly healthy refiner ends up looking broken.
Marathon Petroleum defines capture as reported R&M margin (refining and marketing) divided by its own R&M Margin Indicator. It filed 105% full-year capture for FY2025 on $16.87/bbl of R&M margin, running 2,989 mb/d of throughput at 94% utilisation. Both halves of that fraction are built on the same internal methodology, so the percentage is a clean read on how much of its own benchmark the system kept. Since margin ÷ indicator came to 1.05, the indicator itself averaged about $16.07/bbl.
Hold onto that $16.07. It is the number a reader is most likely to substitute for something else, because it sits well below the national 3-2-1 crack most people reach for.
Other filers publish no capture percentage. Valero reports $12.29/bbl of refining margin; Phillips 66 reports $10.88/bbl on 1,882 mb/d of processed inputs. For those names you compute capture yourself, and whatever you choose as the denominator decides the answer.
So do not rank $12.29/bbl against 105%. Dollars per barrel and a percentage answer different questions until the percentages share a denominator.
The 85–110% Band Belongs to Disclosed Capture
| Capture vs the company’s own indicator | Reading | Action |
|---|---|---|
| Below 85% | Under-capture | Check turnarounds, crude slate mismatch, regional basis |
| 85–110% | Normal operating band | Compare peers that publish on the same basis |
| Above 110% | Favourable timing / inventory | Treat as potentially non-recurring |
The band is a working convention anchored to Marathon’s filed 105%, not a regulatory standard. More importantly, it reads correctly only against the denominator the filer used. Divide the same realised margin by a national crack instead and the answer roughly halves, with nothing about the refinery having changed.
The Same Margins, Measured Against One National Crack
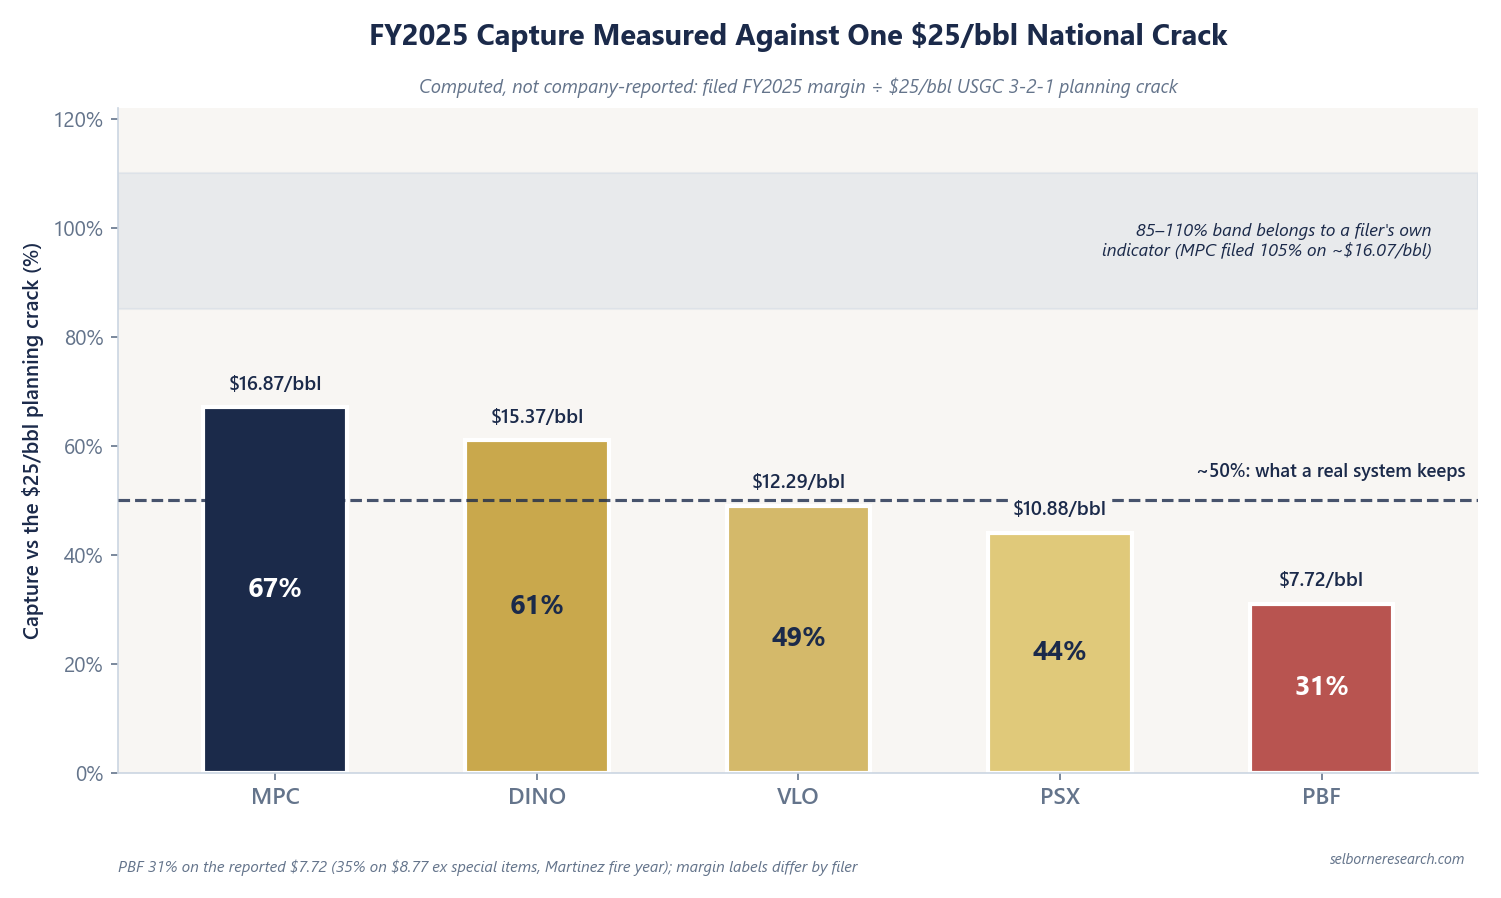
The planning USGC 3-2-1 crack is $25/bbl. Divide FY2025 filed margins by that single indicator and the ratios look nothing like the disclosed ones. These are computed, not company-reported:
| Company | FY2025 margin ($/bbl) | Capture vs $25/bbl planning crack | Note |
|---|---|---|---|
| MPC | $16.87 R&M | 67% | Own indicator averaged ~$16.07/bbl, far below the national crack |
| DINO | $15.37 adj. refinery gross | 61% | Inland system, per produced barrel sold |
| VLO | $12.29 | 49% | Margin already struck after renewable fuel compliance cost |
| PSX | $10.88 realised | 44% | Integrated; chemicals and midstream sit outside this line |
| PBF | $7.72 ($8.77 ex spec.) | 31% (35% ex spec.) | Event year; fire at Martinez |
None of that is under-performance. Roughly half is what a real system keeps of a national 3-2-1, because the crack prices one region, one crude grade and a yield of nothing but gasoline and diesel, and no refinery is any of those three. Every plant makes asphalt, petcoke and residual fuel that sell for less than the crude they came from, buys grades that are not the benchmark, and sells into markets that are not the Gulf Coast.
Which is why the 85–110% band cannot be pointed at a national crack. Doing so would put Valero’s implied margin somewhere between $21 and $27.50/bbl in a year it earned $12.29.
Worked Example: Capture Against the Right Indicator
Take a system whose own margin indicator averaged $16.00/bbl across the year, roughly where Marathon’s sat.
| Capture rate | Indicator ($16.00/bbl) | Implied realised margin |
|---|---|---|
| 110% (top of band) | $16.00 | $17.60/bbl |
| 105% (MPC filed) | $16.00 | $16.80/bbl |
| 95% | $16.00 | $15.20/bbl |
| 85% (floor of band) | $16.00 | $13.60/bbl |
| 80% (under-capture) | $16.00 | $12.80/bbl |
Five points of capture on a $16 indicator is 80 cents a barrel. On a three-million-barrel-a-day system that is close to $880 million a year, which is why refiners bother reporting the number at all.
Building forward from the planning crack works differently, and it is the case most valuation work actually needs. There the capture you apply is the national-crack one, near half: $25/bbl × roughly 50% ≈ $12.50/bbl of realised margin, before cash operating cost, overhead, and any renewable fuel compliance the number does not already carry. That $12.50 is what feeds a mid-cycle EBITDA build. Run the 85–110% band against the same crack and you would have started from twice the margin.
Comparing Peers Without Mis-Ranking
Pick one indicator and stay with it. The EIA Gulf Coast 3-2-1, a company’s internal benchmark and a PADD-specific crack are not interchangeable, and the 3-2-1 formula is only the natural starting point for Gulf Coast-weighted systems.
Valero at $12.29/bbl and Marathon at 105% belong in different cells until each is divided by the same denominator. And Phillips 66’s refining line looks thin at $10.88/bbl, but its refining segment produced $2,338M of adjusted EBITDA against $3,773M from midstream and $845M from chemicals, so the refining margin is not where most of that company’s earnings are.
Normalise margin through capture before valuation, not instead of it. Capture explains part of the gap between an indicator and a realised margin. Operating cost, overhead and the balance sheet account for the rest of the distance to an equity value.
Capture rate ranks operators against the indicator margin. The primer feeds those names into a mid-cycle DCF.
The Excel model is the primer's three refiner DCFs live across 12 sheets: change the crack spread, capture rate or exit multiple and the valuation moves.
Frequently Asked Questions
- What is crack spread capture rate?
- Capture rate is a refiner's realised margin divided by the benchmark margin it measures itself against. Marathon Petroleum defines it as reported R&M margin ÷ its own R&M Margin Indicator, and filed 105% capture for FY2025 on a $16.87/bbl R&M margin. The denominator is the whole point. A disclosed capture near 100% means the system kept almost all of its own internal benchmark. It does not mean it kept almost all of a national 3-2-1 crack, which is a much wider number. Measured against the $25/bbl planning crack, the same year's filed margins came in at 67% for Marathon and 49% for Valero.
- How do you compare refining margins across companies?
- Never rank Valero's $12.29/bbl realised margin against Marathon's 105% capture. One is a margin and the other a ratio, and until they share a denominator they answer different questions. Phillips 66 reported $10.88/bbl on 1,882 mb/d of processed inputs, with midstream and chemicals sitting outside the refining line. Either divide every filed margin by one common indicator, accepting that the resulting percentages land far below 100, or compare $/bbl margins directly while remembering that an inland system, a coastal one and an integrated one do not price off the same regional crack.
- What is a good crack spread capture rate?
- For a company that publishes capture against its own indicator, 85–110% is the working band. Below 85% points to turnarounds, a crude-slate mismatch or regional basis; above 110% usually to crude and product timing or inventory rather than durable outperformance. Marathon's filed 105% for FY2025 sits near the top of it. Against a national crack the band does not apply at all: FY2025 filed margins ran 67% (MPC), 61% (DINO), 49% (VLO), 44% (PSX) and 31% (PBF) of the $25/bbl planning crack, so roughly half is the normal reading there.