ExxonMobil (XOM)
ExxonMobil research profile covering its integrated upstream, refining and chemicals businesses, Permian exposure and valuation framework.
Educational analysis for professional use. This profile is not investment advice or a recommendation to buy or sell any security, and it is not personalised.
Snapshot
Business Overview
The Pioneer deal changed what ExxonMobil is. Before May 2024, Exxon was a sprawling integrated major with decent Permian acreage. After the $60 billion all-stock acquisition closed, it became the basin's largest operator by a wide margin, roughly 15% of total U.S. Permian output. That single transaction reshaped the company's growth trajectory for the next decade.
Exxon now runs four segments: Upstream (exploration and production), Energy Products (refining and marketing), Chemical Products (polyethylene, aromatics and other commodity chemicals), and Specialty Products (lubricants, basestocks and waxes). Full-year 2025 upstream production hit 4.74 million barrels of oil equivalent a day, the highest in over 40 years, but lower crude prices still pulled upstream earnings down to $21.4 billion from $25.4 billion in 2024. Group earnings were $28.8 billion. Shareholder returns ran to $37.2 billion ($17.2 billion dividends, $20.0 billion buybacks).
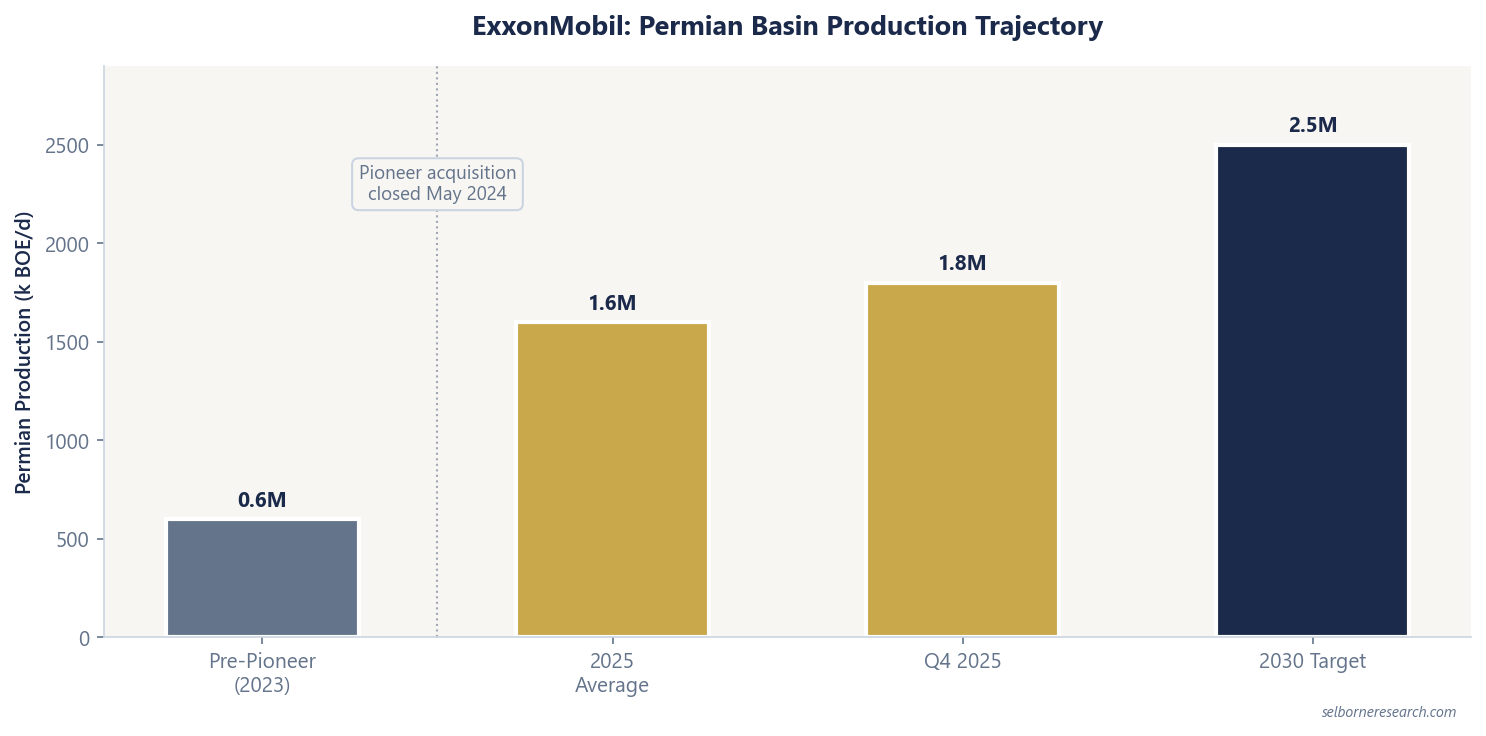
Two assets matter more than everything else: the Permian Basin and Guyana's Stabroek block. The Permian averaged 1.6 million BOE/d net across 2025 and hit a quarterly record of 1.8 million BOE/d in Q4. Guyana averaged above 700,000 gross bpd in 2025, an annual record, across four operating FPSOs. On management's 2030 targets the two together account for well over half of group production. The rest of the portfolio (Gulf of Mexico, Southeast Asia, West Africa, LNG) provides diversification, but Permian and Guyana are the growth engines you should focus on.
How the Economics Work
Exxon's integrated model means upstream earnings volatility gets partially offset by downstream and chemical stability. When oil prices dropped through 2025, upstream earnings fell (Q4 upstream earnings were $3.5 billion, down from $5.7 billion in Q3), but Energy Products earnings jumped to $3.4 billion in Q4. That countercyclical buffer is the structural advantage integrated majors have over pure-play E&Ps. It does not eliminate commodity risk; it dampens it.
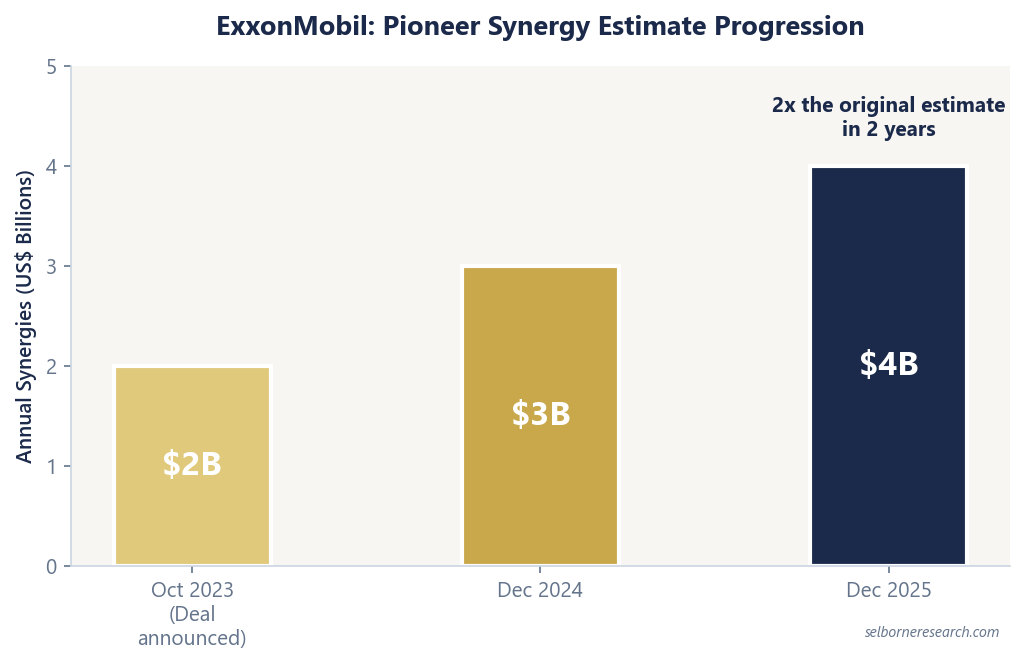
Post-Pioneer, the Permian cost advantage is the margin story. Pioneer brought roughly 700,000 BOE/d of Midland Basin production at a cost of supply below $35/bbl, meaning the crude price at which a barrel repays its drilling capital and earns a full return, not the cash cost of lifting it. Bolted onto Exxon's own Permian position, that more than doubled the company's basin output to about 1.3 million BOE/d on 2023 volumes. Consolidating the two operations means cutting duplicate overhead, optimising drilling schedules, then deploying Exxon's proprietary subsurface technology across Pioneer's acreage. Management originally estimated $2 billion in annual synergies when the deal was announced in October 2023. By December 2024, they raised that to over $3 billion. By December 2025, the target hit $4 billion. Either the original estimates were sandbags or the operational fit is genuinely exceptional. Probably both.
Exxon's proprietary lightweight proppant, made from refinery coke, is light enough to travel further into a fracture and hold more of it open, and across the wells it has been used on so far it has lifted recovery by up to 20%. That kind of gain, applied across the largest contiguous acreage position in the basin, compounds fast. The December 2025 plan guides Permian production to roughly 2.5 million BOE/d by 2030, raised from 2.3 million a year earlier, with no near-term peak in sight.
Guyana's economics are better still. The Stabroek block's four operating developments (Liza Phase 1, Liza Phase 2, Payara and Yellowtail) carry project breakevens of roughly $25-35/bbl Brent, Liza Phase 2 at the cheap end, which puts them alongside or below the Permian on the same measure. Uaru (fifth development, ~250,000 BOE/d, FPSO named Errea Wittu) starts production in 2026. Whiptail (sixth, ~250,000 BOE/d, FPSO named Jaguar) follows in 2027. Hammerhead (seventh) was sanctioned in September 2025 for a 2029 start. Longtail, the eighth, is still in regulatory review; approval would take Stabroek capacity to 1.7 million barrels a day.
Downstream and chemicals round out the picture. Refining margins cycle with crude-product spreads. Chemical earnings track polyethylene demand and feedstock costs. Q4 2025 saw a $281 million loss in chemicals on oversupply and bottom-of-cycle margins. Specialty Products, the lubricants and basestocks arm, earned $2.9 billion against $3.1 billion the year before, which is the whole point of it: it barely moves. The three non-upstream segments earned $11.1 billion in 2025 against $21.4 billion upstream, so roughly a third of what the segments made between them, and the share rises as crude falls. They are not growth businesses, but they earn on margins rather than on the crude price, which is what makes them steadying.
Valuation Framework
Integrated majors require sum-of-parts (SOTP) valuation. Assign separate values to upstream, downstream, and chemicals, then aggregate. Lumping everything into a single EV/EBITDA multiple conflates upstream cyclicality with stable downstream cash flows and will mislead you.
For upstream, apply a reserve-based NAV: discount the proved reserve base at 6-8% (lower than pure-play E&Ps because the balance sheet carries less risk), subtract net debt, then add a risked view of anything beyond proved. Exxon booked 19.3 billion BOE of proved reserves at year-end 2025, roughly 11 years of reserve life against 2025 production, with 7.0 billion of that still undeveloped. Remember that proved reserves are only the certified slice of what the fields will eventually produce, so the NAV you build off them is a floor, not a full valuation of the resource.
Downstream and chemicals get earnings multiples (EV/EBITDA, Price/Book). Their profits move with refining and chemical margins rather than with the crude price, which is why they hold up in the years upstream does not. 2025 was the demonstration: Energy Products earnings rose $3.4 billion while upstream fell $4.0 billion.
The multiple is where the market's scepticism shows. Exxon trades at roughly 7.4x EV/EBITDA, a level that says the market is discounting the durability of upstream earnings rather than doubting this year's. The December 2025 corporate plan update, projecting $25 billion in earnings growth and $35 billion in cash flow growth versus 2024 at constant prices without raising capex, with upstream production rising to 5.5 million BOE/d by 2030, suggests management thinks the market still undervalues the production trajectory.
What to Watch in the Financials
Upstream earnings per BOE. This is the cleanest read on whether Pioneer synergies are translating to margins. As per-well drilling costs fall and G&A gets stripped out, upstream unit earnings should trend upward quarter over quarter. If they stall, the synergy story has a problem.
Permian production trajectory. Full-year 2025 averaged 1.6 million BOE/d. Q4 hit 1.8 million. Getting to 2.5 million by 2030 means adding close to 180,000 BOE/d every year for five years, on a base that declines steeply without constant drilling. Track quarterly volumes; any plateau or deceleration is a yellow flag for parent-child well interference or spacing issues.
Guyana liftings and FPSO startups. Guyana averaged above 700,000 gross bpd in 2025, an annual record, across four FPSOs. Uaru should add 250,000 BOE/d starting 2026. Quarter-to-quarter Guyana volumes can be lumpy (FPSO turnarounds, cargo timing), so focus on trailing-twelve-month trends rather than single quarters.
Downstream utilisation rates. Energy Products earnings surged to $3.4 billion in Q4 2025, partly on improved refining margins. Watch utilisation rates and crack spreads; if global refining overcapacity bites (new Asian capacity coming online), this segment compresses.
Chemical margins. Chemicals posted a $281 million loss in Q4 2025 on oversupply. It is the smallest segment and much the most volatile: full-year earnings fell from $2.6 billion in 2024 to $0.8 billion in 2025. Recovery depends on global polyethylene demand and feedstock costs coming back into line.
Capex versus guidance. Management guides $27-29 billion of cash capex for 2026 and $28-32 billion a year from 2027 through 2030. Capex discipline is what separates post-2020 Exxon from the spending binges of the 2010s. If actual capex consistently overshoots guidance, free cash flow projections need revision.
Buyback pace. Exxon bought back $20.0 billion of shares in 2025. The December 2025 corporate plan frames roughly $145 billion of cumulative surplus cash flow through 2030 at $65 real Brent, the cash left after capex and the dividend. If it runs above plan, watch whether the excess goes to accelerated buybacks or creeping capex.
Peer Context
Against Chevron, Exxon's Permian lead is commanding but not as lopsided as it once was. Chevron averaged 1 million BOE/d in the Permian for full-year 2025, reaching that milestone with 10% less capex than originally planned. Exxon's 1.6 million BOE/d average still gives it a 60% production advantage, and the gap should widen as Exxon ramps toward 2.5 million BOE/d by 2030. Chevron's Hess acquisition (closed 2025) added Guyana exposure (Hess held a 30% Stabroek stake), so both companies now carry significant Guyana upside, though Exxon operates the block.
Against Shell and BP, the contrast is starker. Shell runs a large LNG and deepwater portfolio with longer project cycles and higher decline rates. BP has pivoted toward renewables and smaller E&P assets, though it has recently walked back some transition targets. Exxon's concentrated bet is Permian shale with low decline and short-cycle returns, plus Guyana deepwater at $25-35/bbl project breakevens. Shell and BP offer higher dividend yields but slower production growth and more complex portfolio narratives.
On capital returns, Exxon distributed $37.2 billion to shareholders in 2025, the highest among Western oil majors in absolute terms. The 43-year consecutive dividend growth streak is unmatched in large-cap energy. Chevron competes on yield and discipline, but Exxon's production growth rate gives it the edge on total return potential if oil prices hold.
Capital Returns
Exxon has grown its dividend per share for 43 consecutive years. The current yield sits around 2.6% on roughly $4.04 per share in trailing twelve-month payouts. Management raised the quarterly dividend by 4% in Q4 2025. Room exists for 5-10% annual growth as Permian and Guyana cash flows ramp.
The buyback programme ran at $20.0 billion in 2025, with another $20 billion planned for 2026. Add the dividend and Exxon returned $37.2 billion in 2025, close to 6% of a market capitalisation in the $600 billion range. Capex guidance of $27-29 billion for 2026 funds organic growth without stretching the balance sheet (Debt/EBITDA remains around 0.7x). What sustains the mix is that dividends and capex together came to about $46 billion against $52 billion of operating cash flow, so the buyback is the leg that flexes when crude falls.
Key Risks
Permian parent-child well interference. The Midland Basin's stacked pay zones allow dense drilling, with multiple horizontal wells tapping different formations from the same pad. But drilling a new child well near an existing parent well can steal pressure and cannibalise production from the original completion. Exxon's subsurface modelling is sophisticated, and Pioneer's engineers built detailed interference maps. Still, at the drilling pace required to hit 2.5 million BOE/d by 2030, unforeseen interference could reduce well productivity or force wider spacing. Wider spacing means fewer locations, which shortens the basin's inventory life. At this drilling pace, the trade-off shows up in well productivity before it shows up in volume guidance.
Guyana political and fiscal risk. Guyana has disputed borders with Venezuela, a young petroleum regulatory framework, and rising government assertiveness on fiscal terms. Windfall taxes, royalty increases, and potential changes to state participation are all on the table. Exxon holds long-term contracts that provide some protection, but contract sanctity in a petro-state sitting on sudden oil revenue is never guaranteed. The projects remain profitable at $50 Brent under current terms, but the question is whether current terms survive a future election cycle.
Refining overcapacity. New refining capacity in Asia and the Middle East is coming online through 2027. If global utilisation rates drop materially, Exxon's Energy Products segment (which delivered $3.4 billion in Q4 2025 earnings) will compress. The downstream buffer that smooths upstream volatility only works when refineries run near capacity.
Commodity price cyclicality. Exxon's integration dampens but does not eliminate oil price exposure. Size it yourself: the company lifted about 3.3 million barrels of liquids a day in 2025, so every $10/bbl on the crude price is worth roughly $12 billion a year of revenue before tax and royalty, against $26.1 billion of free cash flow. The December 2025 plan is built on $65 real Brent. Spend long enough below that and the $145 billion of surplus cash flow does not arrive, at which point the buyback pauses well before the dividend is in question.
Energy transition and long-term demand. Oil demand could peak in the late 2020s or 2030s. EV adoption is accelerating, renewable costs keep falling, and policy pressure mounts. Exxon plans about $20 billion of lower-emission investment (carbon capture, hydrogen, lithium) between 2025 and 2030, cut from $30 billion in the previous year's plan, and small either way against core oil and gas spending. Chemical products provide some insulation (polyethylene demand is less tied to energy transition), but upstream E&P faces structural headwinds over a 15-20 year horizon. This risk is already partly reflected in the compressed EV/EBITDA multiple, but if demand destruction accelerates, the multiple contracts further.
Exxon's upstream, refining and chemicals earn on different cycles. The primer values the upstream leg on a reserve-based NAV.
The Excel model is the primer's reserve-based NAV live across 15 sheets: change the oil price, decline rate or discount rate and the valuation moves.