ConocoPhillips (COP)
A globally diversified, supermajor-scale independent E&P company combining production growth with disciplined capital returns to shareholders.
Educational analysis for professional use. This profile is not investment advice or a recommendation to buy or sell any security, and it is not personalised.
Snapshot
Business Overview
ConocoPhillips is the world's largest independent exploration and production company, and it has outgrown the label. At 2,375 MBOED in 2025, it produces more than several integrated majors, without their refineries or chemical plants to smooth the cycle. The company operates across the Lower 48 (Eagle Ford, Bakken, Permian), Alaska's North Slope, Norway, and Asia-Pacific. It holds equity stakes in LNG projects spanning Australia, Qatar, Equatorial Guinea, and the Port Arthur facility now under construction in Texas.
What makes COP unusual among large E&Ps is the explicit returns framework. Management does not chase production growth for its own sake. Instead, the company targets return on capital invested and distributes cash through a three-tier system: a base ordinary dividend, share buybacks, and a variable return of cash (VROC) mechanism that flexes with commodity prices. Full-year 2025 production came in at 2,375 MBOED, of which the Lower 48 supplied 1,484 MBOED, on adjusted earnings of $7.7 billion. The company returned $9.0 billion to shareholders, or 45% of the $19.9 billion it generated from operations. The standing commitment is more than 30% of operating cash flow through the cycle; 45% is what COP has actually paid, not what it has promised.
The Marathon Acquisition: What Changed
The $22.5 billion all-stock acquisition of Marathon Oil, completed 22 November 2024, was the deal that turned COP into something closer to a supermajor. Marathon contributed roughly 390,000 BOE/d, mostly Eagle Ford shale with some Bakken exposure, and over 2 billion barrels of resource at an average point-forward cost of supply below $30 a barrel WTI.
That phrase is COP's own screening measure and it is worth unpacking, because the company applies it to everything it drills. Cost of supply is the WTI price at which a barrel earns a 10% after-tax return once every remaining cost is loaded in: capital, infrastructure, G&A, currency and any carbon tax already levied. Sunk spending is excluded, so it answers a forward question, not a historic one. Marathon's acreage screening under $30 means those barrels clear the hurdle with a wide margin at a $70 WTI planning price.
Synergy capture moved faster than expected. By the end of 2025, COP had doubled its run-rate synergies from the deal to more than $1 billion, through G&A cuts, drilling optimisation, and capital allocation discipline.
The tell on how management thinks sits in the 2026 plan: capex of about $12 billion is roughly $500 million below the midpoint of 2025 guidance, with production held broadly flat. Most acquirers ramp spending after a deal this size. COP pulled back.
How the Economics Work
COP's capital return model has three moving parts, and they behave differently at different oil prices. The base ordinary dividend sits at $0.84 per quarter ($3.36 annualised). Management designs this to survive a sustained downturn; WTI would need to sit below $40 for an extended stretch before the base dividend faced real pressure. Share buybacks run at roughly $5 billion annually at mid-cycle prices, scaled up or down depending on free cash flow. The VROC layer sits on top: when cash generation substantially exceeds capex, dividends, and buyback commitments, management distributes the surplus. The 2025 total was $9.0 billion, and the split tells you which layers actually fired: $4.0 billion of ordinary dividends and $5.0 billion of buybacks, with nothing paid through the variable layer. Management has been routing surplus cash into repurchases rather than one-off cash payments. On a market capitalisation around $145 billion, $9 billion is roughly 6% of the company handed back in a single year.
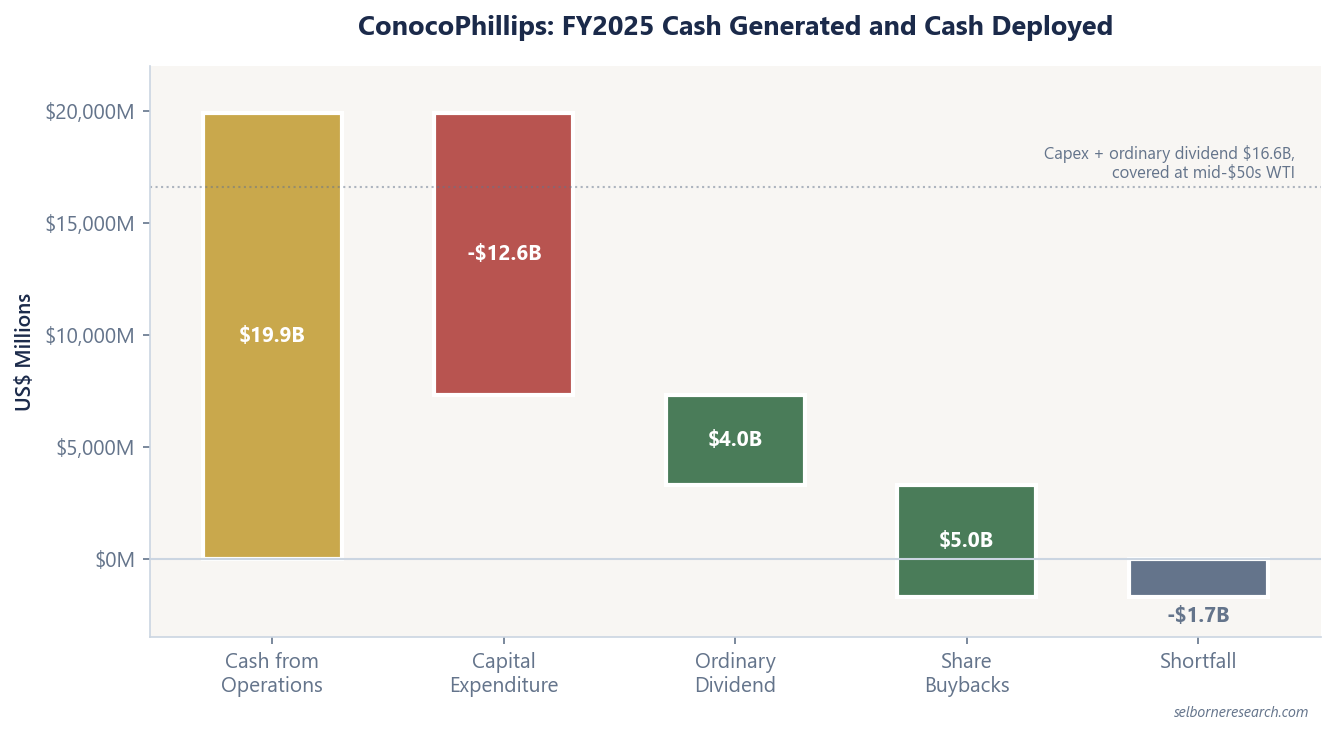
The three-tier model only works if the cost base cooperates. For 2026, COP has guided capital expenditure at approximately $12 billion and adjusted operating costs at $10.2 billion. Both are down: capex from $12.6 billion spent in 2025, operating costs from $10.6 billion, a combined reduction of about $1 billion. The company targets a 10% return on capital employed and delivered that in 2025. Alaska and LNG projects clear lower returns than the shale, but they decline more slowly and produce for longer, which is the trade COP is deliberately making.
COP needs roughly mid-$50s WTI to cover capex and the ordinary dividend; the full three-tier return programme needs $65-70. Below $50, buybacks get trimmed. Below $45 sustained, the model is under real stress.
For valuation, build segment-level production (Lower 48, Alaska, International, LNG), run it at planning prices of $70 WTI and $3.00 Henry Hub, then net off guided capex and operating costs before discounting the free cash flow at 8-10%. Adding barrels that screen under $30 of cost of supply lifts that cash flow at every price above $30, which is why the Marathon deal shows up in a NAV rather than only in headline production.
What to Watch in the Financials
Production vs guidance. The 2026 target is 2.33-2.36 million BOE/d. Q1 2026 guidance is 2.30-2.34M BOE/d, reflecting seasonal weather impacts. Track quarterly results against these figures. Persistent misses would signal integration friction or field underperformance. Watch the Lower 48 segment in particular: it represents over half of total production post-Marathon and carries most of the near-term growth.
Cost per barrel. Adjusted operating costs ran at $10.6 billion in 2025 across 867 million BOE produced, about $12.20 a barrel. The 2026 guide of $10.2 billion on 2.33-2.36 million BOE/d works out near $11.90. Thirty cents does not sound like much until you multiply it by 850 million barrels. If COP delivers that step down while holding volumes flat, the Marathon synergies are reaching the margin. If costs stay put, question the integration story.
Reserve replacement. The reserve replacement ratio compares the barrels a company books in a year against the barrels it pumps out; below 100% and the reserve base is shrinking. COP came in at 80% for 2025 in total, or 99% once purchases and sales are stripped out. Proved reserves stand at 7.6 billion BOE. The three-year averages are healthier at 145% and 106% organic, so a single soft year is not a verdict. A run of them would be.
ROCE and capital intensity. COP delivered 10% return on capital employed in 2025. That sounds modest for an oil company in a decent price environment, but the denominator swelled when Marathon's capital came on the balance sheet. The combined $1 billion of capital and cost reduction planned for 2026 should show up here if the synergies are lifting returns rather than merely arriving.
Capital allocation flexibility. The ratio to watch is distributions over operating cash flow. COP promises more than 30% through the cycle and paid 45% in 2025. If oil drops to $55, operating cash flow contracts and the dollar amount falls with it, because the commitment is a share of the cash rather than a fixed sum. The base dividend survives that; the buyback and the variable return do not have to. Track the quarterly split between the two for what management thinks the oil price is about to do.
Peer Context
COP occupies unusual ground. At 2,375 MBOED it produces roughly twice the next independent down. EOG Resources managed about 1.23 million BOE/d in 2025 and Devon Energy 840,000. Pioneer Natural Resources no longer exists as a standalone; ExxonMobil absorbed it in 2024. So COP's real peer group is arguably the integrated majors, and against them it lacks the refining and chemicals earnings that cushion a weak crude price.
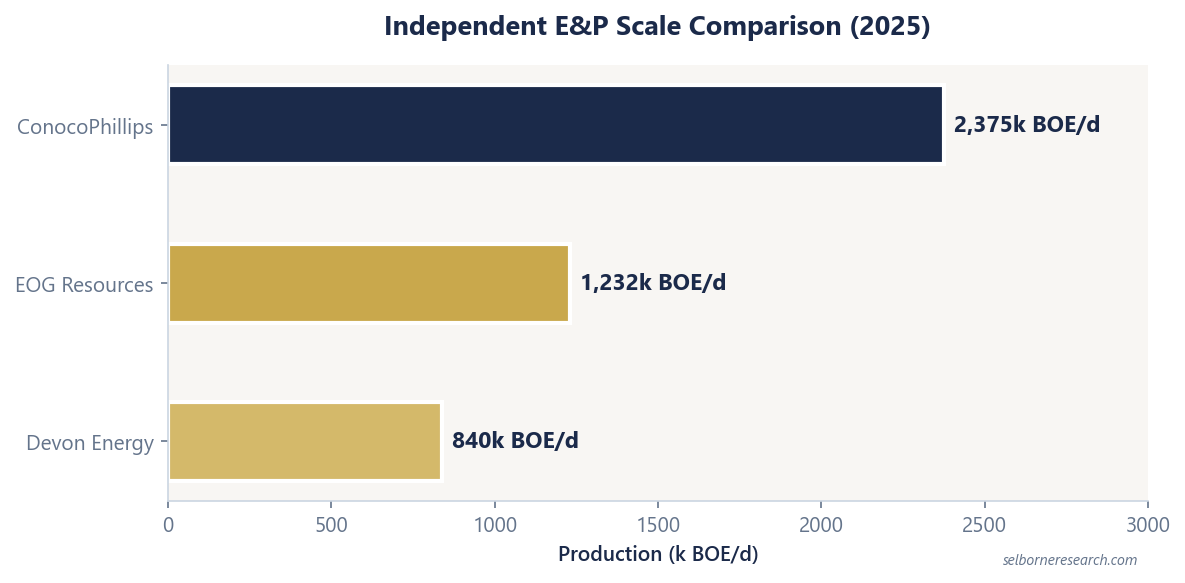
On cost structure, EOG is the benchmark among the large independents, with a breakeven near $50 WTI to cover capex and its regular dividend. Devon sits nearer $45 on the same measure, though that figure dates from May 2025 and has not been restated since its merger with Coterra roughly doubled the company. COP's mid-$50s is higher, and the reason is the portfolio rather than the operating: Alaska and the international business cost more per barrel than the shale sitting alongside them.
What COP buys with that is diversification. EOG and Devon are overwhelmingly Lower 48 shale. COP has Alaska, where Willow reaches first oil in early 2029 and ramps towards a peak of 180,000 bbl/d, Norwegian North Sea production, and a real LNG book. Strong global gas prices and LNG contract repricing reward that mix; cheap gas and a shale-led market favour EOG's narrower focus.
On shareholder returns, COP's $9.0 billion in 2025 is hard to match in cash terms; EOG returned about $4.7 billion and Devon less again. Measured against market value the gap closes and reverses, because EOG is the smaller company: COP's distributions run near 6% of its market capitalisation, EOG's a shade above that. The genuine difference is structure. COP's three-tier model leaves management wide discretion over the top two layers, so the payout tracks the cycle. EOG's fixed-plus-variable dividend is easier to forecast a quarter out. Neither is obviously better; one is a call option on the oil price and the other is a schedule.
Key Risks
Alaska execution risk is real and growing. Willow, on the North Slope, now carries a budget of $8.5-9 billion against an original $7-7.5 billion, the difference mostly inflation and the cost of building in the Arctic. First oil is guided for early 2029. The project was around half complete at the end of 2025, so most of the remaining money still has to be spent before a single barrel is sold, in a remote and environmentally contested place where permitting delays and weather disruption are routine. An appeals court upheld the approvals in June 2025, though it sent one procedural point back to the regulator, and further challenges remain possible.
LNG project execution. COP holds 30% of Port Arthur LNG Phase 1 alongside KKR at 42% and Sempra Infrastructure at 28%, and has contracted 5 million tonnes a year of the output for twenty years. The two Phase 1 trains target commercial operations in 2027 and 2028, with Phase 2 behind them at the turn of the decade. Delay or cost overrun defers an earnings ramp the market is already pricing, and COP does not control the schedule: it is a minority owner in a project someone else operates.
Commodity price sensitivity with a heavier oil mix. Post-Marathon, COP leans further into the Lower 48, so more of the barrel is priced off WTI-Midland and exposed to US drilling economics. A sustained move below $50 WTI takes out the buyback and zeroes the variable return. Below $45, the ordinary dividend starts eating a painful share of the cash the business generates. The 10% return on capital delivered in 2025 came in a reasonable price environment, which is the point: it is close to the level below which the capital stops paying for itself.
Reserve replacement pressure. The 2025 organic reserve replacement ratio of 99% is below the 100% threshold that signals a company is at least holding its reserve base flat. The three-year average (106% organic) is better, but one more weak year could shift the narrative. With proved reserves at 7.6 billion BOE, the current reserve life is roughly 8-9 years at current production rates. That is adequate but not generous for a company this size.
Energy transition and stranded asset risk. COP is pure fossil fuel E&P. No renewables, no carbon capture at scale, no diversification hedge. Regulatory carbon pricing, EV-driven oil demand destruction, and climate litigation are tail risks on a 10-20 year horizon, and institutional NAV models increasingly haircut for them.
ConocoPhillips files its proved reserves in full. The primer works those into a company-level NAV, step by step.
The Excel model is the primer's reserve-based NAV live across 15 sheets: change the oil price, decline rate or discount rate and the valuation moves.