The 3-2-1 Crack Spread: Calculation and What It Misses
EIA Gulf Coast 3:2:1 formula worked through the gallons-to-barrels conversion, and the four things between the crack and what a refiner keeps.
Educational analysis for professional use. This guide is not investment advice or a recommendation to buy or sell any security, and it is not personalised.
The Crack Is a Price Difference, Not a Margin
The 3-2-1 crack spread answers one narrow question: if a refinery bought three barrels of crude and sold the implied product slate at spot on the same day, how much would be left over per barrel before any of its own costs?
The label is the yield assumption. Three barrels of crude go in; two barrels of gasoline and one of distillate come out. EIA’s Gulf Coast version reads:
(2 × Gulf Coast conventional gasoline spot $/gal × 42 + 1 × Gulf Coast ULSD spot $/gal × 42 − 3 × Louisiana Light Sweet spot $/bbl) ÷ 3
ULSD is ultra-low sulphur diesel, the standard road grade. Louisiana Light Sweet, or LLS, is the Gulf Coast crude marker. Dividing by three turns the margin on a three-barrel parcel into a figure per barrel of crude run, which is the form every refiner reports margin in.
That last clause is where the trouble lives. The gap between a crack print and what a refiner actually keeps is wide enough to change an investment case, and most of this page is about it.
Working the Formula Through
Crude quotes in dollars a barrel; gasoline and diesel quote in dollars a gallon. So the unit conversion comes first, at 42 US gallons to the barrel. Miss it and the answer is out by a factor of 42.
EIA’s Gulf Coast spot prices averaged $2.018/gal for conventional gasoline and $2.226/gal for ULSD across calendar 2025.
| Leg | Working | Per 3 bbl of crude |
|---|---|---|
| 2 barrels gasoline | 2 × $2.018 × 42 | $169.51 |
| 1 barrel ULSD | 1 × $2.226 × 42 | $93.49 |
| Product revenue | $263.00 |
That is $87.67 of product revenue for every barrel of crude run ($263.00 ÷ 3). The crack is whatever survives the crude bill. Put crude at $70/bbl and the three barrels cost $210.00, leaving $53.00 across three barrels, or $17.67/bbl. Those same product legs would need crude nearer $62.67 to give a $25/bbl crack.
The sensitivities drop straight out of the formula, which is the main reason to build it by hand once. A dollar on crude takes a dollar off the crack, because three barrels of crude sit against three barrels of product. A cent on gasoline adds 28 cents a barrel (2 × 42 ÷ 3) and a cent on diesel adds 14 cents (42 ÷ 3). Products are the volatile leg, so that is usually where the crack is made and lost.
For through-cycle work we run a planning crack of $25/bbl, deliberately below where the screen has been sitting. A refinery is a forty-year asset and the crack mean-reverts hard, so valuation belongs on a conservative mid-cycle mark rather than the print of the day.
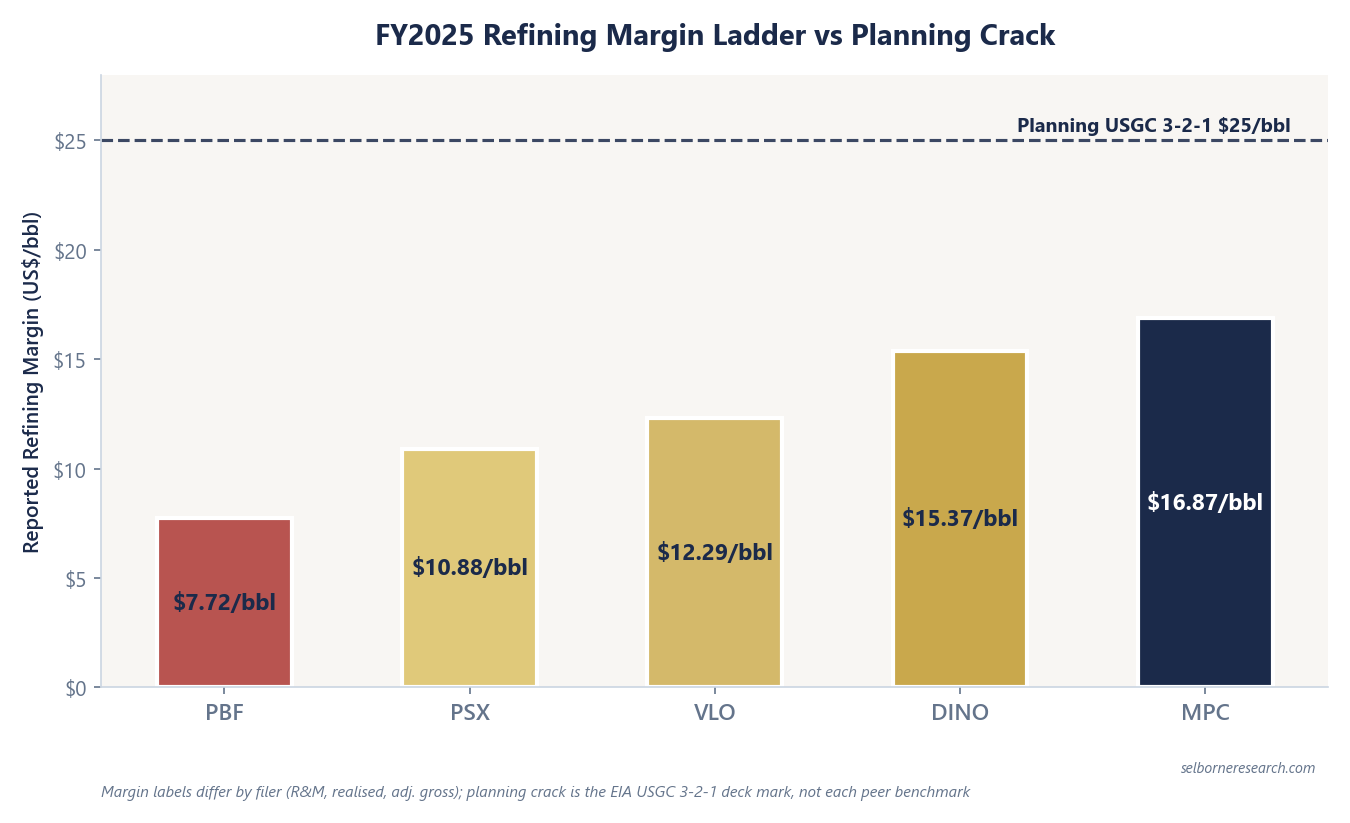
Why No Refiner Earns the Crack
Four things sit between the indicator and the earnings line, and none of them is small.
The refinery’s own costs. Running the plant takes energy, and a refinery burns a real slice of its own throughput to supply it, on top of labour, maintenance and catalyst. EIA is explicit that the crack spread excludes all variable and fixed costs. It is a price difference, not a profit.
Compliance. Valero filed $5.85/bbl of RVO cost in FY2025, up from $3.75 the year before: the market price of meeting its renewable fuel obligation. That sits below the crack line and nowhere in it. See RIN costs.
The slate. Few refineries yield exactly two barrels of gasoline to one of distillate, and complexity decides how far a plant can move off it. Nor does anyone buy the benchmark grade at the benchmark price: a refinery running crude at a discount to LLS keeps the discount, and one paying a premium hands it back.
Geography and timing. Gulf Coast spot is one market of several. Par Pacific processed about 188,000 barrels a day across Hawaii, Tacoma, Billings and Newcastle, none of which clears at a Gulf Coast price. And a plant in turnaround posts a weak quarter while the screen crack stays wide.
Matching the Indicator to the Refiner
Filers rarely quote EIA’s LLS 3-2-1 at all. Marathon Petroleum reported $16.87/bbl refining margin for FY2025 and filed 105% capture, but the denominator there is its own internal margin indicator, which implies about $16.07/bbl ($16.87 ÷ 1.05). Valero reported $12.29/bbl on close to three million barrels a day of throughput and publishes no capture percentage at all.
Those two numbers cannot be ranked against each other until they share a denominator. Sorting that out is the whole job of capture rate.
From Indicator to Valuation
A wide crack is a starting point, never a conclusion. Rank on capture rate and value on mid-cycle EBITDA at the $25/bbl planning crack and 92% utilisation default, not last quarter’s screen.
For upstream assets, operating netback strips field costs from realised price per BOE. The crack spread is the refinery-gate version of that exercise.
The 3-2-1 crack is one gross print. The primer reverts it to mid-cycle inside a ten-year DCF.
The Excel model is the primer's three refiner DCFs live across 12 sheets: change the crack spread, capture rate or exit multiple and the valuation moves.
Frequently Asked Questions
- How do you calculate the 3-2-1 crack spread?
- The EIA Gulf Coast version is (2 × Gulf Coast conventional gasoline spot $/gal × 42 + 1 × Gulf Coast ULSD spot $/gal × 42 − 3 × Louisiana Light Sweet spot $/bbl) ÷ 3. The 42 converts gallons to barrels, since the products quote per gallon and crude quotes per barrel; dividing by three turns the margin on a three-barrel parcel into a figure per barrel of crude run. EIA's Gulf Coast spot prices averaged $2.018/gal for conventional gasoline and $2.226/gal for ULSD (ultra-low sulphur diesel) across calendar 2025, which is $87.67 of product revenue per barrel of crude. Our through-cycle planning crack is $25/bbl.
- What does the 3-2-1 crack spread measure?
- A price difference and nothing more: what three barrels of Gulf Coast crude and the implied two-plus-one product slate are worth at spot on the same day. It carries no operating cost, no compliance cost and no assumption that the refinery you are looking at actually yields two barrels of gasoline to one of distillate. It is not a filer's realised margin. Marathon Petroleum reported $16.87/bbl refining margin for FY2025 against its own internal indicator, not the EIA series; Valero reported $12.29/bbl. Match each system to its own indicator before comparing.
- What does the 3-2-1 crack spread miss?
- Four things, in rough order of size. The refinery's own costs: energy, labour, maintenance and catalyst all come out below the crack line, and EIA states plainly that the spread excludes variable and fixed costs. Renewable fuel compliance: Valero filed $5.85/bbl of RVO cost in FY2025, up from $3.75 the year before. The slate: few refineries yield exactly 2:1, and the crude they buy is rarely the benchmark grade at the benchmark price. Geography and timing: Par Pacific runs about 188,000 barrels a day across Hawaii, Tacoma, Billings and Newcastle, none of which clears at a Gulf Coast price, and a plant in turnaround posts a weak quarter whatever the screen is doing.