Canadian Natural Resources (CNQ)
A leading independent Canadian E&P company with low-decline, long-reserve-life production anchored by oil sands mining and thermal operations.
Educational analysis for professional use. This profile is not investment advice or a recommendation to buy or sell any security, and it is not personalised.
Snapshot
The Dividend Machine
Twenty-six consecutive years of dividend increases. A 20% compound annual growth rate on that payout over that stretch. That is the headline number at Canadian Natural Resources, and it reflects how management prioritises capital returns. Most E&P companies treat dividends as an afterthought, something to offer when oil is high and quietly trim when it falls. CNQ treats the dividend as a constraint the entire capital allocation framework must satisfy. The latest raise, a 6.4% bump to C$2.50 annualised, was announced on 5 March 2026, the same morning the company put an C$8.25 billion mine expansion on hold.
The reason that commitment is credible rather than reckless sits underground. CNQ's oil sands mines, Horizon and the Athabasca Oil Sands Project (AOSP), carry a proved-plus-probable reserve life close to 40 years with near-zero natural decline. A conventional well loses 5-10% of output annually and demands continuous drilling to replace it. An oil sands mine, once operational, just keeps producing. Capital is front-loaded at construction; afterwards, you are funding production from reserves, not from the drill bit. That is why CNQ can produce 1,570,757 BOE/d (2025 actual) while spending less on maintenance than a conventional producer half its size.
Valuation Framework
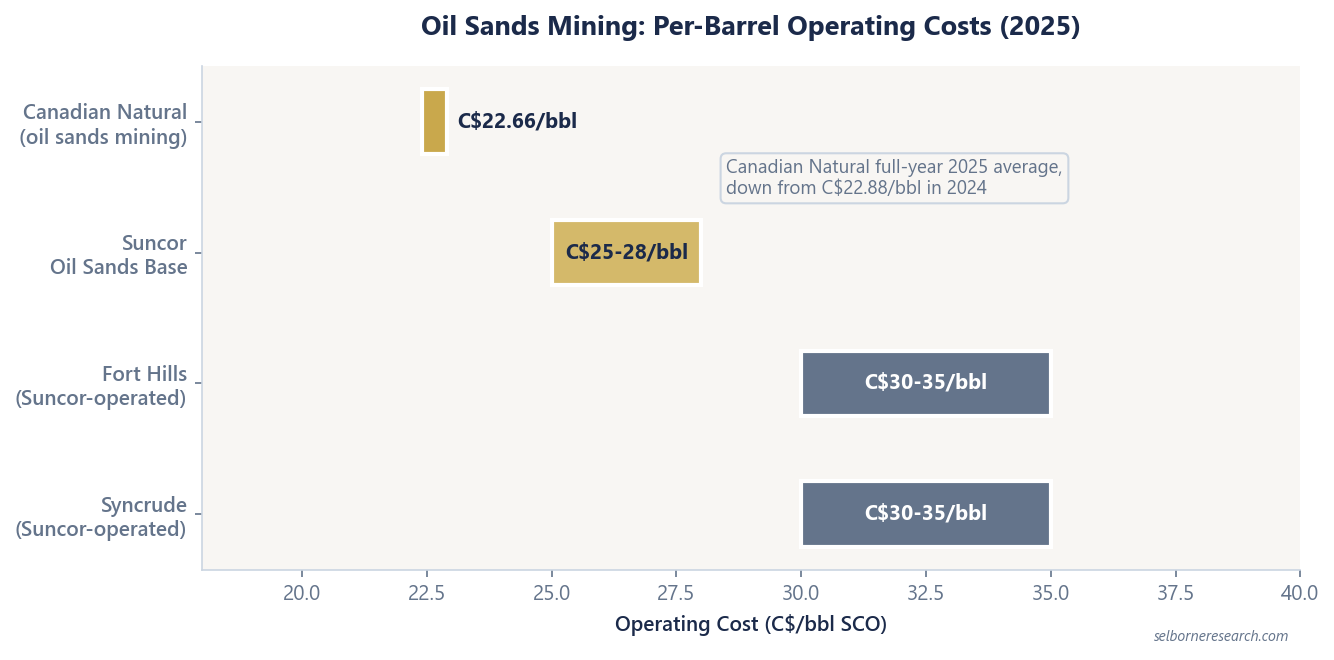
The standard approach is Net Asset Value (NAV). Model each asset's cash flows over its economic life, apply long-term commodity assumptions, discount at 8-10%, subtract net debt, compare to the share price. Our deck runs US$70 WTI, US$3.00 Henry Hub gas and a US$15 Western Canadian Select (WCS, the Canadian heavy-oil benchmark) discount to WTI, all deliberately below where the market is trading. The oil sands segment dominates CNQ's NAV because of those reserve lives. Model AOSP and Horizon on steady-state production with minimal decline. Use C$22-25/bbl all-in operating cost for the mining segment. The 2025 full-year average came in at C$22.66/bbl SCO (US$16.21/bbl), down from C$22.88 in 2024.
Free Cash Flow and Capital Allocation
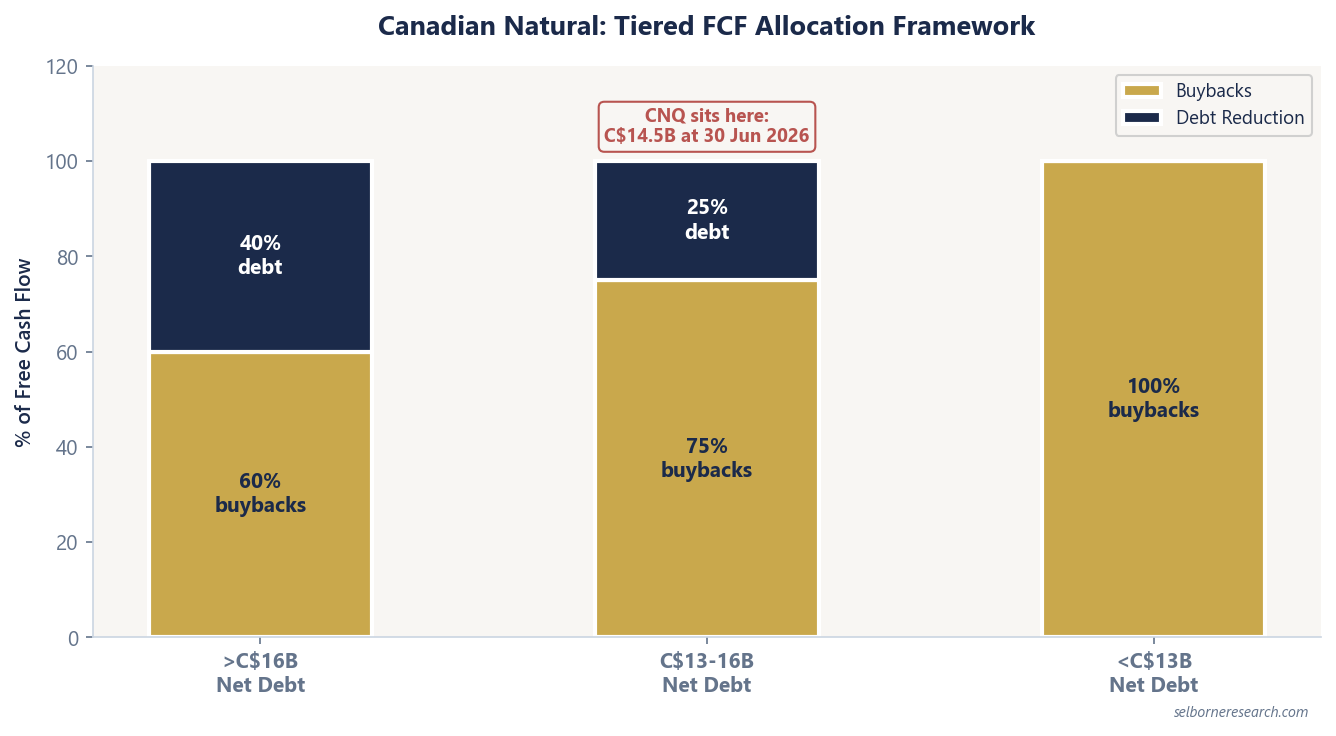
CNQ runs a tiered FCF return policy tied to net debt, all figures in Canadian dollars. Above C$16 billion net debt: 60% of FCF to buybacks, 40% to debt reduction. Between C$13-16 billion: 75/25 split. Below C$13 billion: 100% to buybacks. It is mechanical, transparent, and removes guesswork about what management will do with surplus cash.
The C$2.50 annualised dividend yields roughly 4% at C$63 a share. It costs about C$5.2 billion a year, against adjusted funds flow of C$15.5 billion in 2025. That gap is what makes each raise routine rather than brave: after capital spending, abandonment and the dividend, Canadian Natural still reported C$3.2 billion of free cash flow for the year. Production guidance has been raised twice in 2026, to 1.637-1.682 million BOE/d, on a C$761 million Peace River acquisition and better conventional drilling results.
What to Watch in the Financials
Oil sands mining and upgrading set a record in Q2 2026 at 624,754 bbl/d of synthetic crude, running the upgraders at 106% of nameplate. Capacity on paper is about 592,000 bbl/d, so the plants are being pushed. That output is the cash flow engine, and it is worth tracking quarterly. Cost follows volume closely: a planned turnaround lifted segment operating cost to roughly C$26/bbl in Q2 2025, and a year later, with the mines running flat out, it was C$22.19.
The ownership behind those barrels took two steps, and the second one is often reported wrongly. Canadian Natural bought Chevron's 20% of AOSP for C$9.2 billion in December 2024, taking it to 90%. It then swapped 10% of the Scotford upgrader and the Quest carbon capture plant to Shell in exchange for Shell's last 10% of the Albian mines, closing in November 2025. So it owns all of the mines and 80% of the upgrader, which Shell still operates. Full control of the mining, a minority partner downstream of it.
Operating cost per barrel is the second thing to monitor. A C$2-3/bbl increase across a 625,000 bbl/d base is C$455-685 million of annual segment cash flow, on 228 million barrels a year. Natural gas fires the upgraders as well as the steam plants, so a gas price spike lands directly in oil sands operating cost.
Net debt drives the return framework, and the company sits in the middle tier: C$14.5 billion at 30 June 2026, down C$1.6 billion in the quarter, with the C$13 billion threshold expected in early 2027. Cross it and every dollar of free cash flow goes to buybacks. The quarterly balance sheet, not the share count, is where you watch the approach.
Peer Context
Canadian Natural's C$22.66/bbl mining cost in 2025 sits below every other oil sands mine. Suncor's Oil Sands Base plant ran between about C$25 and C$28 a barrel through the year, improving to C$25.90 in the fourth quarter. Syncrude and Fort Hills, both Suncor-operated, ran in the low-to-mid C$30s. Cenovus is the odd comparison because its SAGD thermal operations (Christina Lake, Foster Creek) produce bitumen at C$10-13/bbl total, but that is unupgraded bitumen selling at a WCS discount, not upgraded synthetic crude priced near WTI. Apples and oranges unless you adjust for realised prices.
On dividends, Suncor yields similarly but lacks the 26-year growth streak. Cenovus has been more aggressive on buybacks relative to dividends. CNQ occupies a middle ground: the most predictable dividend growth among Canadian oil sands producers, backed by the lowest mining-segment unit costs.
Risks and Constraints
Carbon policy is the existential question. Oil sands mining produces roughly 70 kg of CO2 per barrel, among the highest carbon intensities in global crude production. On 5 March 2026 Canadian Natural put the C$8.25 billion Jackpine expansion on hold, 150,000 bbl/d of bitumen, along with the C$150 million of early engineering budgeted for the year, until federal and provincial carbon pricing and methane rules are settled. Ottawa and Alberta are working towards definitive agreements under a memorandum of understanding, targeted for November 2026, and the project stays parked until then. If carbon costs escalate by C$5-10/bbl, that erodes the operating cost advantage over peers and compresses FCF margins. This is not an abstract ESG talking point; it is a line item that management has already cited as a reason to pause billions in growth spending.
WCS differential and TMX dependence. CNQ holds 169,000 bbl/d of committed capacity on the Trans Mountain Expansion (TMX) under twenty-year agreements, part of 256,500 bbl/d of contracted crude export capacity, around a fifth of forecast 2026 liquids production. TMX narrowed the WCS discount to WTI from a historical US$15-20/bbl to roughly US$12. That is a material tailwind, and it is also a dependency: realised heavy oil prices now assume the line runs. An extended outage or a regulatory disruption would widen the differential again and hit revenue directly. Our planning deck runs US$15 under WTI rather than the US$12 on screen, because for a heavy oil producer the conservative case is the wider discount.
Commodity price remains the first-order risk. Note what the tiers do and do not do. They are set by net debt, not by the oil price, so a weak year does not change the split; it shrinks the pool being split and stalls the march towards C$13 billion. Management puts the WTI breakeven for existing operations in the low-to-mid US$40s, meaning adjusted funds flow covers maintenance capital and the dividend at that price. Ask which breakeven any producer is showing you, because a new-well breakeven, an operating breakeven and a corporate breakeven are three different numbers and companies quote whichever flatters. This one is the corporate version, and it is a survival figure, not a return figure.
Operational concentration. Horizon and AOSP together account for the bulk of FCF. Unplanned downtime at either facility, whether a fire, equipment failure, or extended turnaround, immediately hits quarterly cash flow. The Horizon reliability enhancement project, finished in mid-2024, moved turnarounds onto a two-yearly cycle and lifted Horizon to 264,000 bbl/d; a debottleneck at the Scotford upgrader that October took AOSP to 328,000 bbl/d gross. Both help uptime, but oil sands mining is heavy industrial infrastructure with no portfolio offset when one site goes down.
What You Own
CNQ is not a growth story. It is a capital return story built on top of assets that barely decline. The 26-year dividend streak is not an accident of good commodity markets; it survived 2008, 2014, and 2020. The operating cost advantage over Suncor and Syncrude is real, and owning all of the Albian mines gives management the lever to defend it. The question is whether carbon policy and WCS differentials will erode that advantage faster than management can compound returns. If you believe Canadian heavy oil has a multi-decade demand runway and that carbon costs will be manageable, CNQ is among the cleanest ways to express that view. If you think carbon regulation will fundamentally reprice oil sands economics within the next decade, the Jackpine deferral is a preview of what comes next.
Canadian Natural's oil-sands mines run for decades and barely decline. The primer values each one as a life-of-field DCF.
The Excel model is the primer's reserve-based NAV live across 15 sheets: change the oil price, decline rate or discount rate and the valuation moves.