F&D Costs by Basin: Finding & Development Cost Benchmarks
Understand F&D metrics, calculation methods, benchmarks by basin, and how recycle ratios reveal capital efficiency in E&P.
Educational analysis for professional use. This guide is not investment advice or a recommendation to buy or sell any security, and it is not personalised.
What F&D Cost Measures, and Why It Is Easy to Flatter
Finding & Development cost is the price of a barrel a company has not produced yet: the capital it spent divided by the reserves it added.
That makes it the cleanest read on whether an E&P is any good at its actual job, which is manufacturing reserves. It also makes it the easiest number on the page to dress up, because both halves of the fraction can be defined more than one way. Capital can include or exclude the future spending a newly booked barrel will still require. Additions can be measured before or after acquisitions, and they almost always include revisions to reserves booked in earlier years. Revisions move with the oil price. So a company that drilled almost nothing in a year the price rose can post a wonderful F&D cost, having found nothing at all.
Nothing in the formula stops that, which is why the sector reads F&D as a three-year average and reads it beside the margin a barrel earns rather than on its own. This guide covers the calculation and its variants, the bands by basin, and the recycle ratio that turns a cost into a judgement. The reserve estimates underneath it come from decline curve analysis, so F&D inherits whatever optimism sits in a type curve.
Defining F&D Cost
The Basic Formula
F&D Cost ($/BOE) = Capital Expenditure / Reserve Additions (BOE)
Capital expenditures include:
- Exploration drilling and seismic (dry holes count as zero reserves)
- Development wells and completions
- Production facilities and infrastructure
- Non-cash costs are excluded (depletion, impairment)
Reserve additions are:
- New discoveries (from exploration drilling)
- Reserve extensions (from delineation drilling)
- Improved recovery (from optimisation or new technology)
- Revisions to reserves booked in earlier years, positive or negative
That last line is the one that does the damage. A revision is a restatement of barrels the company already owns, and it responds to the price used in the reserves report as much as to anything that happened in the field. Higher prices push marginal barrels back into the economic limit and the revision is positive; lower prices strand them and it is negative. Because revisions land in the denominator alongside genuine drilling results, a rising price can hand a company cheap reserve additions it did nothing to earn, and a falling price can wreck the F&D of a company that drilled well. Multi-year averaging exists to damp exactly this, not because analysts distrust single years in general.
Example:
- Capital spent: $500 million (2024)
- Reserve additions: 50 MMBOE
- F&D = $500M / 50 MMBOE = $10/BOE
Calculation Nuances: “Including Changes in FDC”
The most important nuance is “F&D including changes in FDC” (Future Development Capital). Some companies report F&D differently:
Excluding Changes in FDC (simple):
- F&D = CapEx / Net Reserve Additions
- Counts only capital actually spent in the period
Including Changes in FDC (comprehensive):
- F&D = (CapEx + Change in Future Development Capital) / Net Reserve Additions
- FDC = the capital still needed to develop booked reserves (mostly PUD)
- When new PUD reserves are booked, the associated future capital commitment increases FDC
Practical example:
- Year 1: Spend $100M, book 10 MMBOE → F&D excluding FDC = $10/BOE
- Year 2: Spend $100M, book 8 MMBOE. FDC rises by $40M because the new PUD reserves require $40M of future capital to develop.
- F&D excluding FDC: $100M / 8 MMBOE = $12.50/BOE
- F&D including FDC: ($100M + $40M) / 8 MMBOE = $17.50/BOE
The “including changes in FDC” method is preferred by institutional investors because it captures the full capital commitment to develop booked reserves, not just what was spent this year.
F&D by Basin: Current Benchmarks (2024–2025)
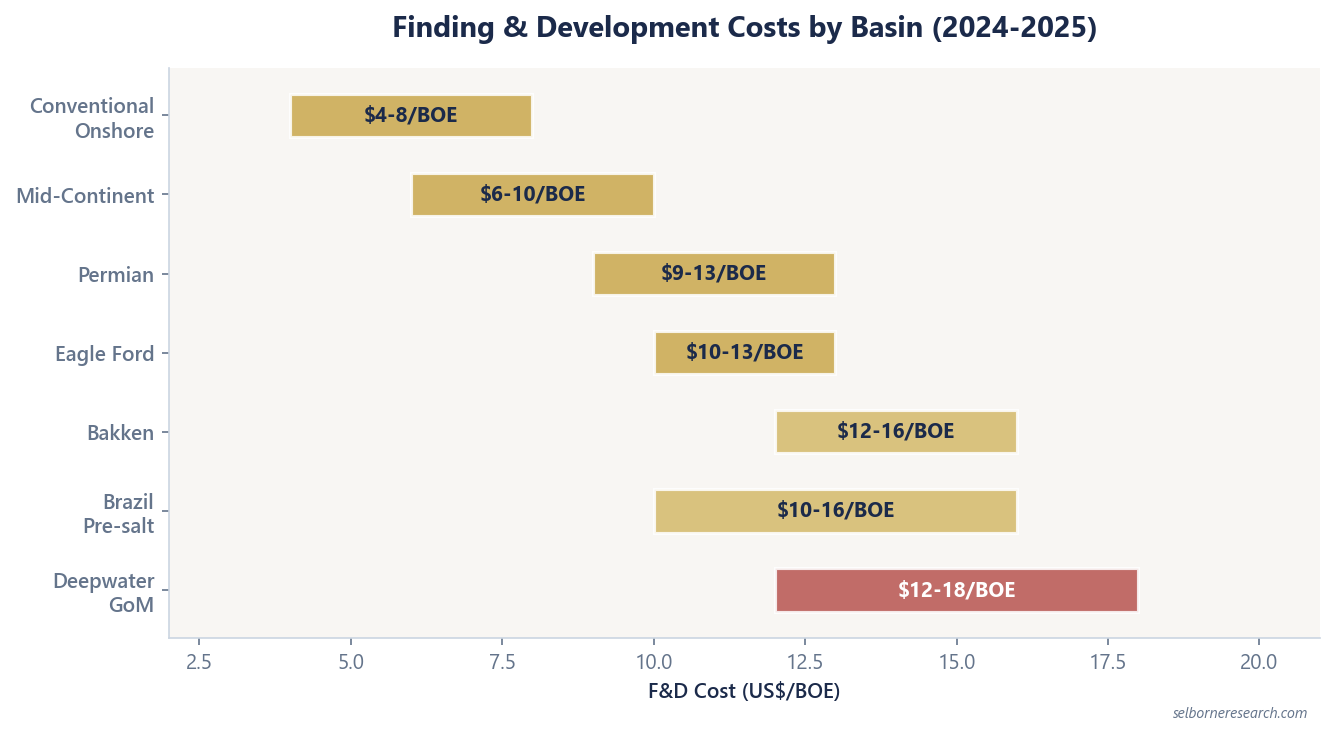
F&D costs vary dramatically by basin due to geology, water depth, infrastructure maturity, and commodity mix. Here are realistic benchmarks:
Unconventional Onshore (Tight Oil / Shale)
Permian Basin (Midland/Delaware)
- F&D: $9–13/BOE
- Mature infrastructure; high success rates; moderate lateral lengths (6,000–8,000 ft)
- Economics compelling at $50+/bbl WTI
- Range reflects 2024–2025 cost inflation (+15–25% since 2021); capital efficiency gains offset by service cost increases
Eagle Ford Shale (Texas)
- F&D: $10–13/BOE for core acreage
- More variable geology (multiple landing zones); higher per-well cost
- Oil-leg wells more economic than gas-leg; edge acreage may exceed $14/BOE
- Development capital intensity rising as operators target core acreage
Bakken (North Dakota)
- F&D: $12–16/BOE
- Remoteness and harsh climate increase service costs
- Pad drilling and longer laterals improve economics
- Volatile production due to crude price sensitivity
The ranking matters more than the levels. The Permian sits cheapest of the three because its infrastructure is built and its wells are close together; the Bakken pays a few dollars a barrel for winter, distance and thinner service competition.
Conventional Onshore
Mid-Continent (Oklahoma, Kansas)
- F&D: $6–10/BOE
- Mature infrastructure; lower drilling costs
- High success rates on small, simple wells
- Low reserve per well, so F&D per BOE can be high if reserves are small
Permian Basin Conventional (not shale)
- F&D: $4–8/BOE
- Proven geology; extensive existing infrastructure
- Lower per-well costs; higher average reserve per well
- Best-in-class economics for conventional development
Deepwater Offshore (Gulf of Mexico)
Deepwater GoM (water depths beyond 1,000 ft, and for the big sub-salt fields beyond 5,000 ft)
- F&D: $12–18/BOE
- High exploration costs (expensive dry holes)
- High per-well development costs (subsea infrastructure)
- Larger reserve pools per field partially offset high capital intensity
Recent trends:
- F&D has declined from $20+/BOE (pre-2015) to $12–15/BOE (2022–2025) due to rig efficiency and lessons learned
- Expectations of future F&D improvement are modest; structural costs remain high
International Conventional (Onshore & Shallow Water)
Southeast Asia (Malaysia, Indonesia)
- F&D: $6–12/BOE
- Mix of onshore and shelf production; mature infrastructure
- Fiscal terms vary significantly by country
- Currency risk on exploration spend vs. USD production revenue
North Sea (UK, Norway)
- F&D: $8–15/BOE
- High infrastructure costs; regulatory requirements
- Mature provinces with low discovery rates; extensions dominate
- Development timeline stretched (environmental, permitting delays)
Brazil Offshore (Pre-salt)
- F&D: $10–16/BOE
- Very large discoveries; high infrastructure capital
- Excellent long-term economics due to scale
- Political/regulatory risk adds premium
Africa (Ghana, Nigeria, Angola)
- F&D: $8–14/BOE (onshore); $15–20/BOE (offshore)
- Highly variable by specific project
- Deep-water developments carry high F&D due to infrastructure requirements
- Fiscal terms (government take) can be aggressive (40–50%+)
F&D Trends Over Time
F&D has shifted significantly over the past decade. These trends are reflected in how companies report reserves and capital efficiency in their annual reserves reports:
2010–2012 (High Oil Prices):
- F&D averaged $12–15/BOE across most basins
- Exploration aggressive; drilling costs high
- Many discoveries proved uneconomic at subsequent lower prices
2015–2017 (Price Crash & Recovery):
- F&D fell to $8–11/BOE as companies focused on efficiency
- Dry holes declined; drilling rigs idled
- Shift toward lower-risk, high-return development plays
2018–2020 (Mature Optimisation):
- F&D stabilised at $7–12/BOE depending on basin
- Completion optimisation (Permian infill drilling, pad efficiency)
- Lower exploration spend; focus on development
2021–2025 (Inflation & Commodity Volatility):
- F&D rising: $9–14/BOE across most basins
- Service cost inflation (labour, equipment, materials) +15–25%
- Limited new exploration; reserve replacements rely more on extensions
Reserve Replacement Ratio and Sustainability
F&D cost only matters if connected to reserve replacement. The reserve replacement ratio (RRR) tells you whether the company is sustainable:
RRR = Net Reserve Additions (BOE) / Annual Production (BOE)
A company replacing everything it produces at a cost above what a barrel earns is running a very expensive treadmill. Setting the two against each other gives the recycle ratio:
Recycle ratio = operating netback per barrel / F&D cost per barrel
The numerator is the operating netback: the field-gate cash margin after royalties, lifting costs, transport and field overhead. Not the oil price, and not the price less lifting cost. Substituting the raw price for the netback in the example below turns a 3.7x into 6.4x, which is why any recycle ratio quoted without its netback build is worth nothing.
The one rule that decides whether the ratio means anything
Both legs have to describe the same barrel. This is where the metric gets quietly broken, usually by accident.
An oil barrel and a company-wide BOE are not the same unit. Six Mcf of gas count as one BOE on heat content, but at a $3.00/MMBtu deck they sell for about $18 against $70 for the oil barrel, so they earn a fraction of the margin while adding a whole barrel to the denominator. Divide an oil-barrel netback by a company-wide F&D per BOE and you have credited the oil margin to the gas barrels. The ratio comes out flattered, and nothing on the page tells you.
Worked example, at a $70/bbl WTI planning deck
Take a Permian-style producer with F&D of $11/BOE, the middle of the basin band above.
On the oil barrel, both legs matched:
- Operating netback: $41.00/bbl (the netback build: $70 realised, less $14 royalties and production taxes, $9 LOE, $4 transport, $2 field G&A)
- F&D on those oil barrels: $11.00/bbl
- Recycle = $41.00 / $11.00 = 3.7x
On the company as a whole, where roughly half the volumes are gas and NGLs netting nearer $10 per BOE:
- Blended netback: (0.55 × $41.00) + (0.45 × $10.00) ≈ $27/BOE
- Recycle = $27 / $11.00 = 2.5x
Same company, same quarter: 2.5x if you match the barrels, 3.7x if you do not. Neither figure is a lie; only one of them answers the question.
Now put it against the treadmill. Say the company produces 100 MMBOE a year and replaces 90% of it:
- Reserves to replace: 90 MMBOE × $11/BOE = $990 million of capital
- Field cash margin: 100 MMBOE × $27/BOE = $2,700 million
- Left over before corporate G&A, interest and tax: $1,710 million
The useful shortcut sits in those numbers. The reciprocal of the recycle ratio is roughly the share of field margin that goes back into the ground just to stand still: at 2.5x, about 40 cents in every dollar. At 1.5x it is two thirds, and there is very little left for the balance sheet or shareholders. Recycle ratios feed straight into NAV and EV/DACF work for the same reason.
Where the bar sits
- Below 1.0x: the barrel costs more to add than it earns. Value is being destroyed, whatever production is doing.
- 1.0–2.0x: thin. Replacement absorbs most of the field margin, leaving little for corporate costs, interest and tax, which all sit below the netback line.
- 2.0–3.0x: healthy. The standard screening bar is 2.0x.
- Above 3.0x: strong, though check it is not an artefact of a mismatched basis or a price-driven revision.
Treat that ladder as a bar at a stated price deck rather than a law. The numerator moves with the oil price, so the same assets print a very different ratio at $90 than at $70. Quote the deck alongside the ratio, or the ratio means nothing.
F&D vs. Recycle Ratio Trade-offs
Different basins face inherent trade-offs:
Low F&D, Low RRR (mature conventional plays):
- F&D: $5–8/BOE
- RRR: 50–70% (mature field, limited upside)
- Implies: Good near-term cash, but production declining without growth capex
Moderate F&D, Moderate RRR (core unconventional):
- F&D: $9–13/BOE
- RRR: 80–120%
- Implies: Balanced; good cash generation with sustainable growth
High F&D, High RRR (exploration-driven):
- F&D: $15–25/BOE
- RRR: 120–200% (multiple discoveries, high-upside case)
- Implies: Capital-intensive near-term; potential for step-change growth; higher risk
Common F&D Calculations and Pitfalls
Bought Barrels Are Not Found Barrels
Reserves acquired in a corporate or asset deal are usually cheaper per barrel than reserves drilled, because the seller has already spent the capital and the buyer is paying a discounted price for proved production. Fold them into the same ratio and the drill bit gets credit for the deal.
The convention that avoids this is to keep two numbers. F&D covers drilling and development only. FD&A, finding, development and acquisition cost, adds the purchase price and the barrels it bought. Both are legitimate; a company reporting only the second, in a year it made an acquisition, is showing you the flattering one.
Example:
- Drilling and development: $400 million for 25 MMBOE → F&D = $16.00/BOE
- An acquisition: $100 million for 20 MMBOE → $5.00/BOE
- Combined: $500 million for 45 MMBOE → FD&A = $11.11/BOE
The company’s capital efficiency at what it actually does is $16, not $11. Ask which number is on the slide.
Count the Wells That Missed
An exploration-led company can also improve its F&D by counting only the wells that worked:
- Successful drilling: $250 million, adding 25 MMBOE → $10.00/BOE
- Dry holes and abandoned exploration that year: $50 million
- All-in: $300 million / 25 MMBOE → $12.00/BOE
The second figure is the one that describes the business, because the dry holes were the price of the discoveries. Shale operators rarely face this gap, since a development well in a proved play almost always finds something; explorers live on it.
F&D Over Different Time Horizons
A single year’s F&D is close to meaningless, for the reason set out at the top: revisions swing with the commodity price, and one large discovery or one bad well lands entirely in one year.
- One year: distorted by revision timing, a single discovery, or a big dry hole
- Three years: the working standard, and long enough for price-driven revisions to cut both ways
- Five to ten years: shows the structural trend, including whether a company’s inventory is getting more expensive as it drills its best rock first
If a company quotes a one-year F&D and not a three-year average, assume the one-year number was the better of the two.
Where F&D Sits in a Valuation
F&D does not get deducted from the barrels already in the reserve report. Those barrels carry their own development capital inside the cash flow model, and deducting F&D on top would charge them twice.
What F&D prices is the barrel after the last one. A reserve-based NAV discounts the booked reserves and stops. Whether the company is worth more than that depends on what it costs to keep adding, and F&D is the only observable estimate of it. A producer adding barrels at $11 against a $27 netback can go on doing so, and its undeveloped acreage is worth something. One adding them at $25 has a NAV that ends when its booked reserves do, however impressive the production line looks.
It is also the sane way to read an acquisition. A company that can buy proved barrels for $8 when its own drilling adds them at $16 is being told something by the market about its drilling programme.
What a Low F&D Does Not Prove
A falling F&D is not automatically a company getting better at its job.
The most common benign-looking version is inventory harvesting. An operator drills its best remaining locations, books cheap barrels, prints a strong F&D and a good recycle ratio, and quietly runs down the stock of places worth drilling next. Nothing in either metric shows it. The tell is elsewhere: a shrinking undeveloped reserve base, an operator talking about lateral lengths and spacing rather than new acreage, or a step up in acquisition spending to buy the inventory the drill bit stopped replacing.
So read F&D with two things beside it. The reserve replacement ratio tells you whether the volume is being replaced. The recycle ratio tells you whether replacing it is worth doing. A low F&D with a replacement ratio well under 100% is a company liquidating itself efficiently. That is a real investment case, provided you know that is what you are buying and the share price reflects it. See the Oil & Gas Sector Primer for how these screens sit inside a full valuation.
Finding cost only matters against the margin a barrel earns. The primer sets F&D against netback in a recycle ratio.
The Excel model is the primer's reserve-based NAV live across 15 sheets: change the oil price, decline rate or discount rate and the valuation moves.
Frequently Asked Questions
- What is F&D cost in oil and gas?
- Finding and Development (F&D) cost measures how much capital a company spent to add one barrel of oil equivalent to its reserve base: exploration and development capital divided by net reserve additions. Both halves of that ratio can be defined more than one way, which is why F&D is the easiest E&P metric to flatter. The additions figure usually includes revisions, and revisions move with the commodity price as much as with the drill bit, so a single year's F&D can look excellent in a year the company barely drilled. Read the three-year average.
- What is a good F&D cost for an E&P company?
- It depends on the basin and on how the company defines the ratio. As rough bands, Permian shale development runs around US$9-13 per BOE, mature conventional onshore can sit below US$8, and deepwater Gulf of Mexico runs US$12-18. A low F&D is not automatically good news: it can mean a company is drilling out its cheapest remaining locations and not replacing the inventory behind them. The number worth having is F&D against the margin a barrel earns, which is the recycle ratio.
- What is the recycle ratio and why does it matter?
- The recycle ratio divides operating netback per barrel (the field-gate cash margin, after royalties, lifting costs and transport) by F&D cost per barrel. It answers how many dollars of field margin each dollar of finding cost buys. Below 1.0x the company spends more adding a barrel than the barrel earns, which destroys value; above about 2.0x the economics are healthy at the assumed price deck. Both legs must describe the same barrel: an oil-barrel netback divided by a company-wide F&D per BOE flatters the ratio, because the denominator counts gas barrels the numerator never earned.