Free Cash Flow Conversion for Primes
Why primes screen on free cash flow against net income, the operating-cash-to-FCF bridge, and how the FY2025 conversion ratio varies across the peer set.
Educational analysis for professional use. This guide is not investment advice or a recommendation to buy or sell any security, and it is not personalised.
FCF Conversion Tells You Whether EPS Is Cash
Defence primes report healthy GAAP earnings. The question for shareholders is how much of that translates to distributable cash after capex. FCF conversion (company-defined FCF ÷ net income) is the standard screen because percentage-of-completion revenue, contract working-capital swings and FAS/CAS adjustments, the gap between pension expense under US accounting rules (FAS) and the different figure used to price government contracts (CAS), routinely decouple EPS from cash.
Primes know this. General Dynamics weights FCF at 25% of annual incentive compensation in its 2026 proxy, alongside diluted EPS (25%) and operating margin (20%). If management is paid on FCF, equity analysts should not stop at P/E.
How FCF Is Defined
General Dynamics’ FY2025 10-K defines free cash flow as net cash from operating activities less capex. That is the company definition used across the peer set for conversion ratios:
FCF conversion = FCF ÷ GAAP net income
Operating cash flow can exceed net income while FCF conversion sits lower, because capex sits between the two. The distinction matters on every prime where OCF runs above 100% of earnings.
The GD Bridge: Where Cash and Earnings Split
General Dynamics is the cleanest filed example of the OCF-to-FCF gap:
| Metric | FY2025 | vs net earnings |
|---|---|---|
| Net earnings | $4.2B | 100% |
| Operating cash flow | $5.1B | 122% |
| Free cash flow | $4.0B | 94% |
The gap between the operating-cash line and the FCF line is capex, nothing more exotic. A prime that shows strong operating cash conversion alongside a lower, still-healthy FCF figure is not hiding a profit-quality problem. It is spending on the business between the two. Check the capex line first, before reaching for an earnings-quality explanation.
FY2025 Conversion Across the Peer Set
Filed FCF conversion across the six-name peer set:
| Company | FCF | Net income | Conversion |
|---|---|---|---|
| L3Harris | $2.7B GAAP | $1.6B | 170% |
| Lockheed Martin | $6.9B | $5.0B | 138% |
| RTX | $7.9B | $6.7B | 118% |
| General Dynamics | $4.0B | $4.2B | 94% |
| BAE Systems | £2.2B | £2.3B underlying | 92% |
| Northrop Grumman | $3.3B | $4.2B | 79% |
The range runs wide. Comms-heavy businesses with capex running below depreciation convert best; platform primes carrying heavier tooling spend sit lower. L3Harris’ own GAAP figure understates its cash generation slightly: adjusted FCF came in at $2,814M against the $2,736M GAAP number, a gap from stock-based compensation and acquisition costs typical of a serial acquirer.
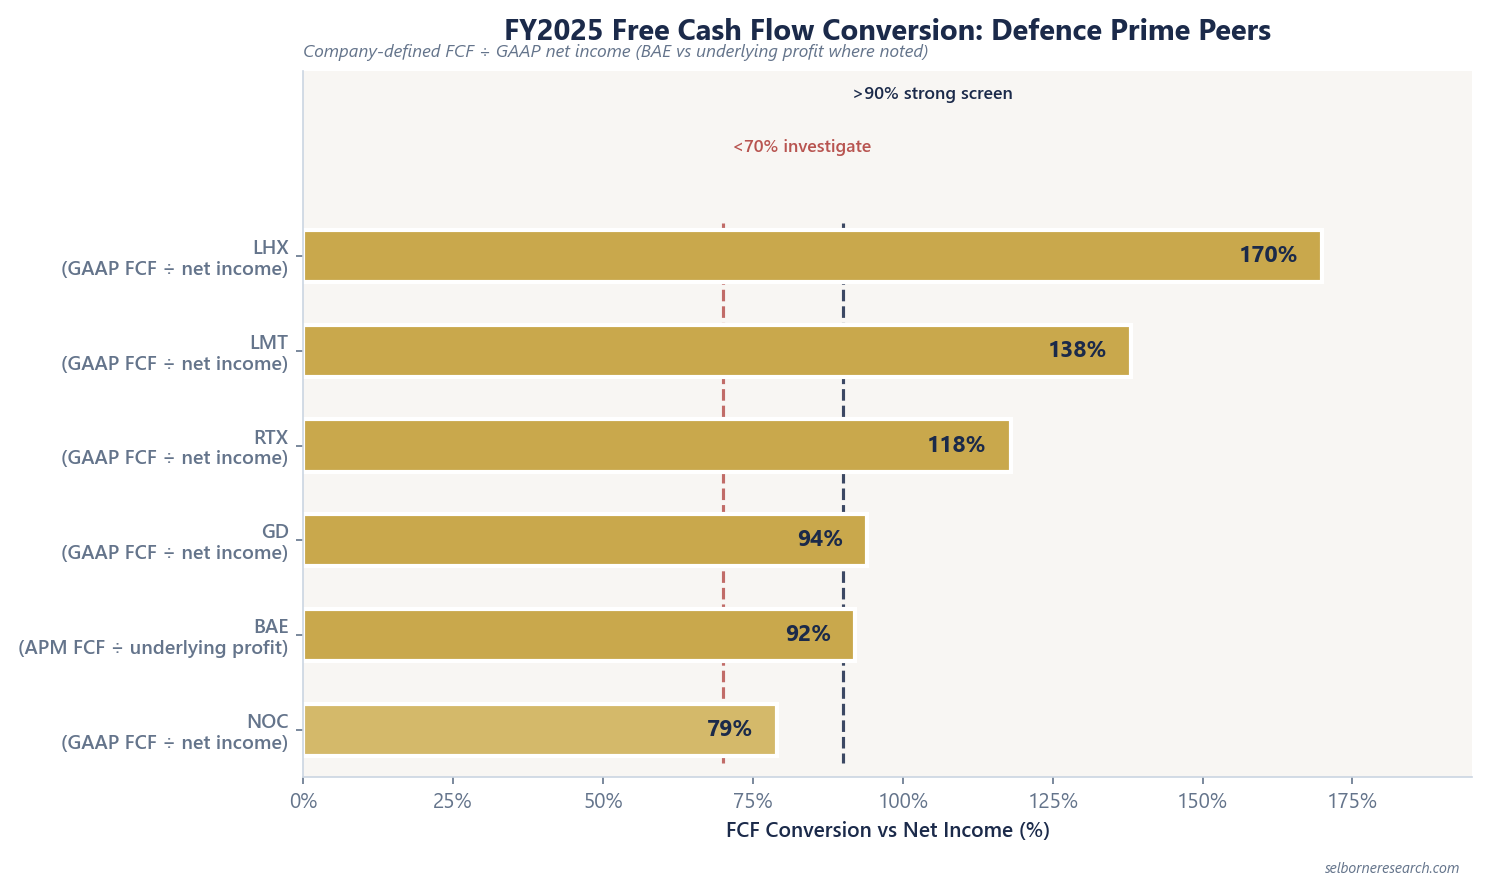
House screen bands:
| Band | Conversion | Action |
|---|---|---|
| Strong | >90% | Cash supports or exceeds earnings |
| Normal | 70-90% | Typical long-cycle timing |
| Investigate | <70% | Working-capital or capex review |
Why Conversion Exceeds 100%
Three forces push conversion above 100% at platform and systems primes:
Pension and FAS-CAS. Pension income or lower CAS contributions can inflate operating cash relative to segment operating profit. The effect varies by filer and year.
Working-capital timing on long-cycle contracts. Billings can precede revenue recognition on cost-type work, or lag on fixed-price milestones. A single quarter’s conversion can swing 20-30 points without a structural change.
Capex below depreciation. Mature programmes often run sustaining capex below the D&A charge embedded in net income, particularly at comms-heavy names like L3Harris.
L3Harris is the extreme case in this set: its GAAP net income materially understates the cash the business actually throws off. That is why an earnings multiple and a cash yield can read differently for the same company, the mechanism the valuation guide walks through.
Why Conversion Sits Below 90%
Northrop Grumman’s 79% is a useful case because it shows the mechanism rather than a problem. Net earnings of $4.2B exceeded FCF of $3.3B by roughly $875M, and on a pure defence prime with classified platform work, working-capital builds on new awards and capex on programme tooling can pull FCF below earnings in a strong order year.
Before treating sub-90% conversion as a red flag:
- Check whether book-to-bill was above 1.0 (NOC ran 1.10x; orders can front-load working capital).
- Compare OCF to net income (if OCF is also below 100%, the issue is broader than capex).
- Look at pension/FAS-CAS in the cash-flow statement reconciliation.
Contract Mix Explains Part of the Spread
Cost-type contracts tend to convert cash more predictably because billings track allowable costs. Fixed-price milestones can bunch revenue recognition and cash collection in different periods. NOC’s portfolio is approximately half firm fixed-price; GD’s US government revenue is 51% fixed-price, 44% cost-reimbursement, 5% time-and-materials. The contract-type guide maps how mix drives segment margin dispersion; conversion follows the same contract mechanics on a lag.
L3Harris’ Communication Systems segment posts a 25.2% operating margin and sits at the top of this peer set on conversion. General Dynamics’ Combat Systems segment posts a lower 14.4% margin yet converts in the middle of the pack. Billing terms explain the gap better than margin does.
Using Conversion in Valuation
Conversion is an input to FCF yield, not a valuation metric in its own right. The workflow:
- Compute conversion from filed FCF and net income.
- Where conversion runs above 100% (Lockheed Martin, L3Harris), check FCF yield before leaning on trailing P/E alone; the earnings multiple is understating the cash the business generates.
- Where conversion runs below 90%, don’t assume the cash yield is weak too. Yield depends on the price paid as well as the cash generated, so compute it separately rather than inferring it from the conversion ratio.
- Where a company discloses FCF as a pay metric (General Dynamics weights it at 25%), that is a signal management is watching cash as closely as earnings.
The L3Harris profile is the top-of-ladder teaching case for this mechanic. General Dynamics shows the OCF-to-FCF bridge cleanly. Northrop Grumman sits at the bottom of the conversion ladder in this set, which is where the earnings-based and cash-based screens diverge most.
Funded backlog and FCF conversion are the inputs. This primer takes them to a ten-year cash-flow value and an FCF yield you can screen.
The Excel model is the primer's two archetype builds live across 11 sheets: a ten-year, backlog-driven free-cash-flow DCF with a Gordon terminal. Change the book-to-bill, the FCF conversion ratio or the WACC and the value per share moves; the backlog, conversion-bridge and concentration sheets update alongside it.
Frequently Asked Questions
- What is free cash flow conversion for defence primes?
- FCF conversion is company-defined free cash flow (operating cash flow less capex) divided by GAAP net income. Primes weight FCF in incentive compensation because percentage-of-completion revenue, pension/FAS-CAS adjustments and working-capital swings decouple EPS from distributable cash. General Dynamics' 2026 proxy weights FCF at 25% of annual incentive compensation alongside diluted EPS (25%) and operating margin (20%).
- What is a good FCF conversion ratio for defence contractors?
- House screen: above 90% strong; 70-90% normal; below 70% investigate working-capital or capex timing. The FY2025 peer range spans L3Harris 170% (GAAP), Lockheed Martin 138%, RTX 118%, General Dynamics 94%, BAE Systems 92% (vs underlying profit) and Northrop Grumman 79%. NOC at 79% sits in the normal band, reflecting typical long-cycle timing rather than a problem, and it is part of why its cash yield runs behind its earnings multiple.
- Why does operating cash flow differ from FCF at defence primes?
- Capex timing sits between operating cash flow and FCF. General Dynamics generated $5.1B operating cash flow in FY2025, 122% of $4.2B net earnings, but FCF was $4.0B (94% conversion) after capex. The 122%-to-94% gap is the capex bridge, a timing effect that says nothing about earnings quality. Pension/FAS-CAS adjustments and contract working-capital swings can widen the OCF-to-net-income gap further.
- Why do defence primes use FCF in executive compensation?
- Long-cycle contract accounting recognises revenue and profit on percentage-of-completion bases that do not align with cash collection timing. FCF captures what is distributable after capex. GD's proxy explicitly weights FCF at 25% because shareholders and credit markets screen primes on cash conversion, not EPS alone. High conversion (LHX 170%, LMT 138%) often signals that GAAP net income understates distributable cash.