Defence Prime Book-to-Bill Benchmarks
FY2025 book-to-bill ranked across RTX, GD, LHX, LMT, BAE and NOC, each with backlog and the filer's own orders-to-revenue definition beside it.
Educational analysis for professional use. This guide is not investment advice or a recommendation to buy or sell any security, and it is not personalised.
A Book-to-Bill Ranking Only Reads Cleanly Once You Know the Formula Behind Each Number
Book-to-bill is orders divided by revenue. Above 1.0, a company booked more new business than it recognised as revenue, and backlog grows. The arithmetic is the same everywhere. What differs is what each filer counts as “orders” and what it counts as revenue, and that difference is large enough to change how a peer table should be read.
Rank six defence primes by book-to-bill without checking definitions and you are comparing RTX’s orders-to-revenue ratio against Northrop Grumman’s net-awards-to-sales ratio as if they were the same measurement. The two are close in spirit and different in mechanics. This guide ranks the six filers on their FY2025 figures and states each one’s own formula next to it, so the ranking means what it looks like it means.
FY2025 Book-to-Bill, Ranked
The table below ranks the six-name set on FY2025 book-to-bill as filed (Lockheed Martin’s figure is call-cited, not filed, and is footnoted). Backlog sits beside each ratio because a prime can carry a large backlog with a modest book-to-bill if older, mature programmes are converting to revenue faster than new work is being booked.
| Rank | Company | FY2025 book-to-bill | Backlog | Filer’s own formula | Filed? |
|---|---|---|---|---|---|
| 1 | RTX | 1.56x | $268B | Orders ÷ revenue | Yes |
| 2 | General Dynamics | 1.50x | $118B | Orders ÷ revenue (company-wide) | Yes |
| 3 | L3Harris | 1.30x | $38.7B | Orders $27.5bn ÷ revenue $21.9bn | Yes |
| 4 | Lockheed Martin | ~1.2x | $193.6B | Management-cited, Q4 2025 call | Not filed |
| 5 | BAE Systems | 1.20x | £83.6B | Order intake £36.8bn ÷ sales £30.7bn | Yes |
| 6 | Northrop Grumman | 1.10x | $95.7B | Net awards $46.3bn ÷ sales $42.0bn | Yes |
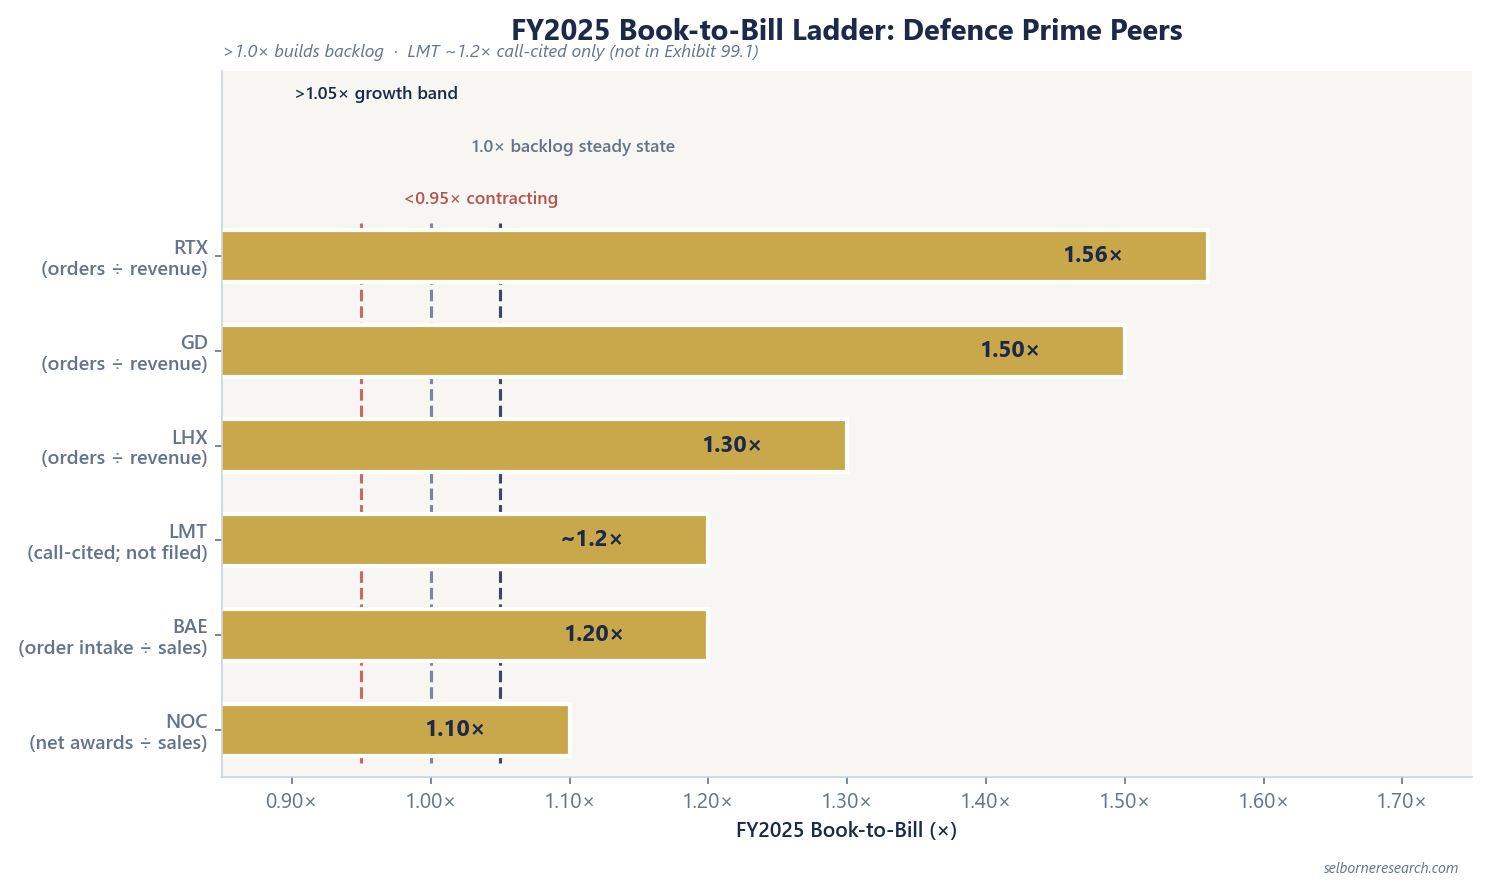
General Dynamics’ figure in the table is the company-wide one. Its three defence segments alone ran to 1.6x, on defence-segment backlog that grew from $70.9bn to $96.2bn, a 36% increase in a single year. That is the same company producing two different ratios depending on whether Gulfstream’s business-jet segment is inside or outside the denominator, exactly the kind of scope difference a ranking has to state rather than hide.
What Counts as an “Order” Differs by Filer
Three phrasings cover the six-name set, and they are not interchangeable:
- Orders ÷ revenue (RTX, GD): new contract value booked in the period, divided by revenue recognised in the same period.
- Net awards ÷ sales (Northrop Grumman): awards net of contract modifications and de-scopes, divided by sales.
- Order intake ÷ sales (BAE Systems): new order value received, divided by sales, reported in sterling.
“Net” matters. A gross award figure that ignores cancellations and scope reductions overstates the booking rate, so Northrop’s net-awards convention is arguably the more conservative of the three. Whether that conservatism moves NOC’s 1.10x meaningfully below where a gross-award version would land is not something the filed disclosure lets you check.
Reading the Ratio Against a Band
Above 1.0 is the minimum bar: it means orders outpaced revenue and backlog is building, all else equal. We use a finer three-band read as a working convention we state rather than source, anchored to the spread this six-name set already shows:
| Band | Ratio | Read |
|---|---|---|
| Contracting | <0.95 | Backlog likely shrinking |
| Steady | 0.95-1.05 | Orders tracking revenue |
| Growth | >1.05 | Backlog building |
Every filer in this set sits at or above 1.0 for FY2025, so none falls in the contracting band this year. That is a statement about order momentum across large-platform and systems-integration primes generally in 2025, and it says nothing on its own about any one company’s prospects. A single strong year does not establish a trend, and a book-to-bill ratio is silent on margin, cash conversion, or programme risk on the business generating it.
The LMT-BAE Tie Is Two Different Kinds of Number
Lockheed Martin’s ~1.2x and BAE Systems’ 1.20x land at almost the same level in the table above, and treating them as equivalent evidence would be a mistake. BAE’s 1.20x is a filed figure: order intake of £36.8bn against sales of £30.7bn, disclosed in the FY2025 results. Lockheed Martin’s ~1.2x came from management’s remarks on the Q4 2025 earnings call and does not appear in Exhibit 99.1 or the 10-K.
Neither figure is wrong. But a filed ratio and a call-cited estimate carry different weight in a cross-peer screen, and stacking them in the same column without a footnote erases that distinction. This is also why Lockheed Martin’s $193.6bn backlog, the largest in dollar terms after RTX, is easier to verify than the ratio describing how fast that backlog is being replenished.
Where a Naive Ranking Goes Wrong
The most common error when this table gets built quickly is mixing General Dynamics’ two ratios: quoting its defence-segment figure next to RTX’s company-wide number understates how close the two actually are, because GD’s own company-wide figure is the comparable one.
A call-cited figure is not a filed one, either. Lockheed Martin’s ratio needs a footnote every time it sits beside a number pulled from a 10-K.
The ratio also gets misread as a cash signal, when all it measures is order momentum. A prime can post a strong book-to-bill and still show weak free cash flow if working capital or capex timing moves against it in the same period. Check FCF conversion separately before drawing a conclusion about either.
Funded backlog and FCF conversion are the inputs. This primer takes them to a ten-year cash-flow value and an FCF yield you can screen.
The Excel model is the primer's two archetype builds live across 11 sheets: a ten-year, backlog-driven free-cash-flow DCF with a Gordon terminal. Change the book-to-bill, the FCF conversion ratio or the WACC and the value per share moves; the backlog, conversion-bridge and concentration sheets update alongside it.
Frequently Asked Questions
- How is book-to-bill calculated for defence primes?
- Book-to-bill is orders (or net awards, or order intake) divided by revenue in the same period. Above 1.0 means orders outpaced revenue recognised and backlog should build. The catch is the numerator: RTX and GD use orders ÷ revenue, Northrop Grumman uses net awards ÷ sales, and BAE Systems uses order intake ÷ sales. These are close but not identical definitions, so a cross-peer ranking needs the filer's own formula stated beside the ratio.
- Which defence prime had the highest book-to-bill in FY2025?
- RTX filed the highest ratio in the six-name set at 1.56x (orders ÷ revenue), on more than $138bn in new awards against $88.6bn revenue. This is an operational read on order momentum, not a valuation signal: a high book-to-bill says backlog is growing, nothing about where a share trades.
- Why doesn't Lockheed Martin publish a filed book-to-bill ratio?
- Lockheed Martin management cited approximately 1.2x on the Q4 2025 earnings call, but that figure does not appear in Exhibit 99.1 or the FY2025 10-K. Treat it as directional and footnote it as call-cited whenever it sits next to a filed ratio from another prime.
- What book-to-bill ratio counts as healthy for a defence contractor?
- We use a three-band read as a working convention we state rather than source: below 0.95 signals backlog contracting, 0.95 to 1.05 is steady state, and above 1.05 signals growth. All six FY2025 filers we track sit at or above 1.0, with NOC lowest at 1.10x and RTX highest at 1.56x.