Accident Year vs Calendar Year Combined Ratio
Why one insurer can quote two different combined ratios for the same period and both are correct, and how to tell which basis a number sits on.
Educational analysis for professional use. This guide is not investment advice or a recommendation to buy or sell any security, and it is not personalised.
The Same Insurer Can Quote Two Combined Ratios and Both Are Right
AIG’s 2025 results say its General Insurance combined ratio was 90.1%. The same release says it was 88.3%. Neither figure is a mistake, and a third number the release never prints, 92.2%, is arguably the truest of the three. They answer different questions, and the label tells you which one you are reading.
A calendar-year combined ratio counts everything booked during the period. If actuaries revised the estimate on a 2019 claim in the fourth quarter of 2025, that revision lands in the 2025 loss ratio. An accident-year combined ratio assigns each loss to the year the accident happened. A 2025 accident-year ratio contains only 2025 claims, however many years they take to settle out.
The gap between the two figures for the same period is prior-year reserve development. Our reserve development guide covers what drives that development and which direction the signs run; this page is about telling the two bases apart in the first place.
The Bridge Between Them
One line does the work:
Calendar-year combined ratio = accident-year combined ratio, less favourable prior-year development in points (or plus adverse development)
Nothing else moves between the two. Same premiums, same expenses, same current-year claims. The only difference is whether the period carries the reappraisal of older accident years.
That has a consequence worth sitting with. A calendar-year figure is fixed once the period closes; it is a record of what was booked. An accident-year figure is a live estimate that keeps moving. The 2025 accident-year ratio a company shows in its FY2025 release is that year’s loss position as valued at 31 December 2025. Ask again three years later and the same accident year will carry a different number, because more claims have settled and fewer are estimates. When you compare accident-year ratios across companies, check they are struck at the same valuation date; an accident year seen from twelve months out is not the same object as one seen from four years out.
Worked Example: One Ratio, Two Bases
AIG reported a General Insurance combined ratio of 90.1% for FY2025. In the same release it disclosed 2.1 points of favourable prior-year development, 3.9 points of catastrophe losses, and an accident-year combined ratio of 88.3%. Those four numbers describe one year of underwriting, and they reconcile:
| Basis | FY2025 General Insurance combined ratio |
|---|---|
| Accident year as AIG labels it, catastrophes excluded | 88.3% |
| Add catastrophe losses | +3.9 pts |
| Accident year, all in | ~92.2% |
| Less favourable prior-year development | −2.1 pts |
| Calendar year, as reported | 90.1% |
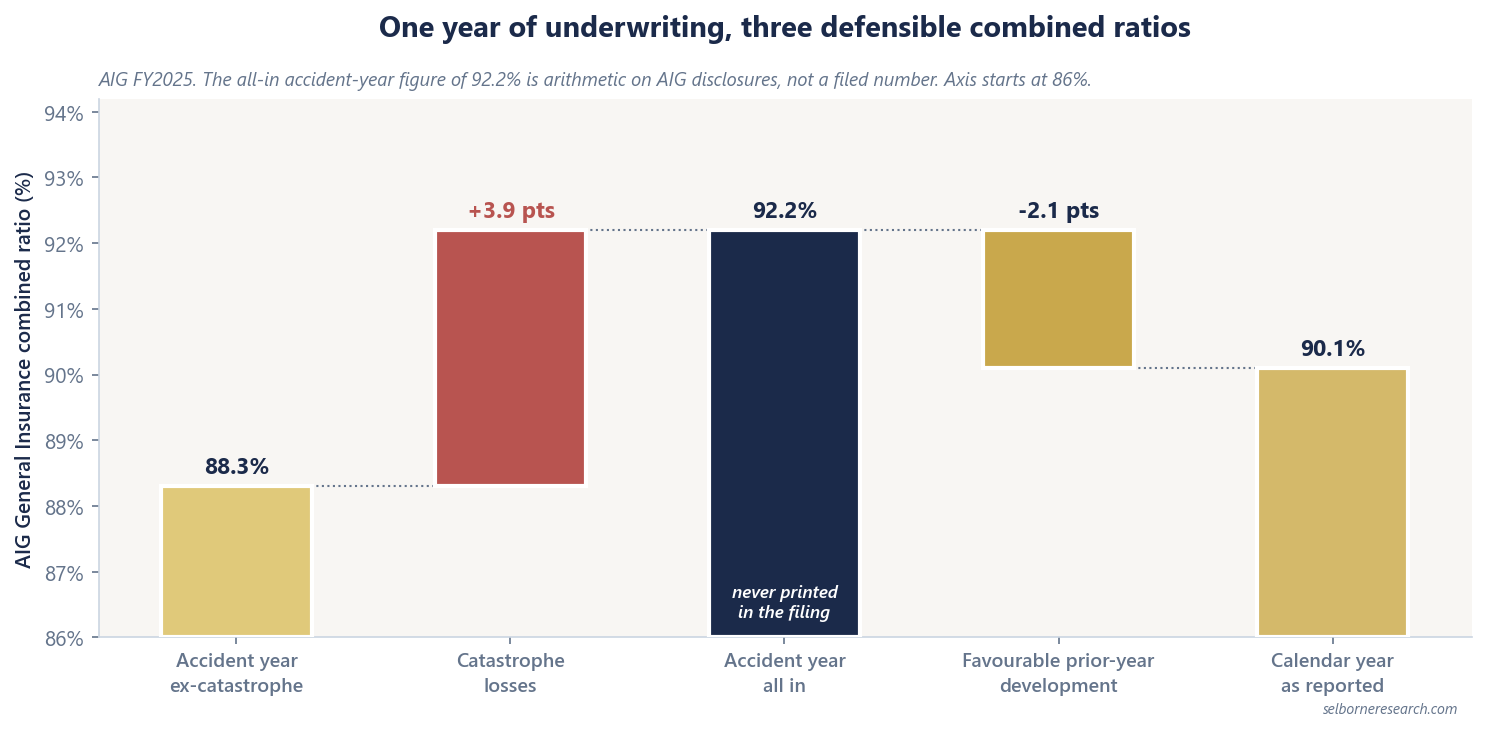
Watch what the word “accident year” is doing in that table. AIG’s own accident-year print is 88.3%, and it has had the weather taken out as well as the development. The all-in accident-year figure, the one that says what 2025 actually cost, is 92.2%, and no filing prints it: it is arithmetic on AIG’s disclosures. Say so when you use a number you built yourself.
The 2.1 points of releases are a real economic benefit; the reserves genuinely were redundant. But they are news about how earlier years were reserved, not about how 2025 was priced. Rank AIG’s underwriting discipline on 90.1% and you are giving 2025 credit for judgements made in prior years.
Why the Basis Question Bites
The trap is not a company quoting the wrong number. It is a comp table that mixes them.
Consider what the flattering choice looks like. An insurer whose current-year pricing is slipping can hold its calendar-year combined ratio flat for several years by releasing a little more from prior reserves each period. The headline ratio says underwriting is stable. The accident-year ratio, if you can see it, says it is deteriorating and the difference is being funded from a store that eventually empties. Releases are finite; that is the whole reason to look through them.
Now consider the honest version of the same problem. Two insurers both run a 92% combined ratio. One is calendar year with three points of releases inside it; the other is accident year with none. The second company is underwriting roughly three points better than the first, and the table shows them level.
The FY2025 comp ladder below is safe to rank precisely because every row sits on the same basis:
| Company | FY2025 combined ratio | Basis | FY2025 favourable development |
|---|---|---|---|
| Chubb (CB) | 85.7% | Calendar year, P&C | $1,133m pre-tax |
| Progressive (PGR) | 87.4% | Calendar year, companywide | $1,394m |
| Travelers (TRV) | 89.9% | Calendar year, consolidated | $1,036m pre-tax |
| AIG General Insurance | 90.1% | Calendar year, GI segment | $548m, 2.1 pts |
All four are calendar year, and all four took releases in FY2025. Only AIG published the point impact on the ratio. For the other three, converting dollars into points needs net earned premiums, which you take from the same filing. Do that conversion before you claim a 4.4 point spread between Chubb and AIG is a spread in underwriting quality.
The Third Variant: Accident Year Ex-Catastrophe
Analysts routinely see a third figure: accident year ex-catastrophe, sometimes written AY ex-cat or “underlying”. It takes the accident-year ratio and removes catastrophe losses on top.
Its purpose is legitimate. Weather is lumpy, and a hurricane landing in one company’s territory tells you little about whether its rate filings are keeping up with claims inflation. Strip cats out and consecutive years become more comparable.
Its danger is equally plain. Catastrophes are a real cost, they recur, and the amount removed is not small. Catastrophe losses added an estimated 7.6 points to the 2025 US industry combined ratio and 8.8 points in 2024. A company presenting only its ex-cat ratio is showing you a business that does not exist, one that never pays for the weather. Treat the ex-cat number as a trend diagnostic and the all-in accident-year number as the economics.
There is a useful ordering rule here. In a year with favourable development, the all-in accident-year ratio is the highest of the three: calendar year sits below it by the release, ex-cat sits below it by the cat load. Which of those two ends up lower tells you whether the period’s releases were bigger than its catastrophes. AIG’s 2025 is the ordinary case, 92.2% all-in, 90.1% calendar year, 88.3% ex-cat, because 3.9 points of weather outweighed 2.1 points of releases. Turn the development adverse and the order changes: the calendar-year ratio moves above the all-in accident year and becomes the highest of the three, which on its own tells you the company strengthened reserves.
How to Check Which Basis You Are Holding
Run through this before a number enters a model.
| Check | What it tells you |
|---|---|
| Does the label say accident year, calendar year, or underlying? | Settles it outright. Absent a label, assume calendar year: that is the reporting default. |
| Does the release also quote prior-year development? | If development is disclosed and the ratio moves by that amount elsewhere in the document, you are looking at both bases. |
| Is a catastrophe load quoted separately? | A quoted cat load usually means an ex-cat variant sits nearby. |
| Does the same period’s ratio differ between two documents? | Restated accident-year figures move at each valuation; calendar year does not. |
| Is the figure struck at the same valuation date as its comparators? | Accident-year ratios re-estimate over time, so mixed valuation dates are not comparable. |
When the disclosure does not say, ask. Investor relations will tell you, and the question is a normal one. Publishing a comp table with an unlabelled ratio in it is how a basis mismatch becomes a recommendation.
What to Take Into a Model
Accident year answers “how did we underwrite this year?” Calendar year answers “what hit the P&L this year?” Both are worth knowing, and a P&C analyst who cannot say which one a given figure is has no idea whether the underwriting story is real.
Rank underwriting quality on accident year where it is disclosed, or on calendar year with development stripped back out where it is not. Use calendar year when you are modelling reported earnings, because that is the basis earnings are struck on, and it is the basis that feeds the float and investment-income engine alongside net investment income. Keep the ex-cat variant for trend work, never for valuation.
The combined ratio is only a scoreboard if everyone on it played the same game.
Getting the basis right fixes one period's ratio. The primer folds a through-cycle underwriting path into a ten-year book roll-forward.
The Excel model is the primer's three residual-income valuations live across 13 sheets: change the combined ratio, the spread or the cost of equity and the justified P/BV moves.
Frequently Asked Questions
- What is the difference between accident year and calendar year combined ratio?
- A calendar-year combined ratio counts every loss amount booked during the period, including revisions to claims from earlier years. An accident-year combined ratio assigns each loss to the year the claim event occurred, so a 2025 accident-year ratio holds only 2025 claims however long they take to settle. The gap between the two figures for the same period is prior-year reserve development.
- Which combined ratio basis do insurers report by default?
- The headline combined ratio is calendar year unless the label says otherwise. IRMI defines the combined ratio as the sum of the calendar-year loss ratio and the expense ratio, and that is the number in most earnings-release summary tables. Accident-year and accident-year ex-catastrophe figures usually appear deeper in the release or supplement, where the company chooses to show them.
- What is accident year ex-catastrophe combined ratio?
- It is the accident-year ratio with catastrophe losses removed, used to show the underlying loss trend without weather and event noise. It is always the flattering variant, because catastrophes are a real and recurring cost. Catastrophe losses added an estimated 7.6 points to the 2025 US industry combined ratio and 8.8 points in 2024, so the amount being stripped out is large.
- How do I convert a calendar-year combined ratio to an accident-year one?
- Add back the prior-year development that ran through the period, expressed in combined-ratio points. AIG disclosed 2.1 points of favourable development on its FY2025 General Insurance combined ratio of 90.1%, which implies roughly 92.2% before that benefit. Where a company discloses development only in dollars, divide by net earned premiums to get the point impact yourself.