Combined Ratio Benchmarks 2026: Progressive to AIG
How to place any P&C insurer on the combined-ratio ladder: the four bands, what structurally drives a company into each, and FY2025 comps from Chubb to AIG.
Educational analysis for professional use. This guide is not investment advice or a recommendation to buy or sell any security, and it is not personalised.
A Combined Ratio Only Means Something Once You Know the Band
An insurer at 91% is not “nine points better” than one at 100% in any way you can bank. One sits in a band where underwriting alone funds the return; the other is relying entirely on the investment portfolio. Ranking names on the decimal is how analysts waste an afternoon. Placing them in bands, then asking what put them there, is the work that survives a change in the numbers.
This page is the ladder. If you need the arithmetic behind the ratio itself, the combined ratio scoreboard guide covers the loss and expense components and why investment income sits outside.
The Four Bands
The 100% line is definitional: below it the book made an underwriting profit, above it the book lost money before a dollar of investment income. The other cut points are house screens, drawn where the behaviour of the business genuinely changes.
| Band | What it means | What structurally puts a company here |
|---|---|---|
| Below 90% | Exceptional. Underwriting alone funds a strong return | A real structural edge: favourable line mix, low expense ratio, limited catastrophe accumulation, or pricing power in specialty lines. Rare to hold for a decade without one of those |
| 90-95% | Strong. Comfortable underwriting profit; our screen for quality | Disciplined pricing and reserving in a normal loss year. Most well-run diversified writers land here when catastrophes behave |
| 95-100% | Profitable, but thin. Investment income is carrying the return | Heavier catastrophe load, competitive personal lines, or a broker-distributed expense base. A bad wind season pushes this band through 100% |
| Above 100% | The book loses money before investment income | Underpricing, adverse reserve development, an outsized event year, or growth bought with rate cuts |
Two anchors sit inside this frame. Progressive discloses a company guardrail of growing as fast as possible subject to a calendar-year combined ratio of 96% or better, which is Progressive’s policy rather than an industry rule. And an insurance trade-body study of the US P&C industry found it needed roughly 95.5% to earn a 12% return on equity in 2024 conditions, against 90.5% in 2021. That pair is the useful part: the ratio a business has to hit for a given return is set by what its portfolio earns, so it loosens as yields rise and tightens as they fall.
Where the FY2025 Prints Landed
Four large US names, all reporting for the year ended 31 December 2025:
| Company | FY2025 combined ratio | Basis | Band |
|---|---|---|---|
| Chubb (CB) | 85.7% | Companywide P&C | Below 90% |
| Progressive (PGR) | 87.4% | Companywide | Below 90% |
| Travelers (TRV) | 89.9% | Consolidated | Below 90% |
| AIG | 90.1% | General Insurance segment | 90-95% |
| US industry (AM Best) | 92.2% | Preliminary statutory | 90-95% |
| US industry (Verisk + APCIA) | 92.9% | Preliminary statutory | 90-95% |
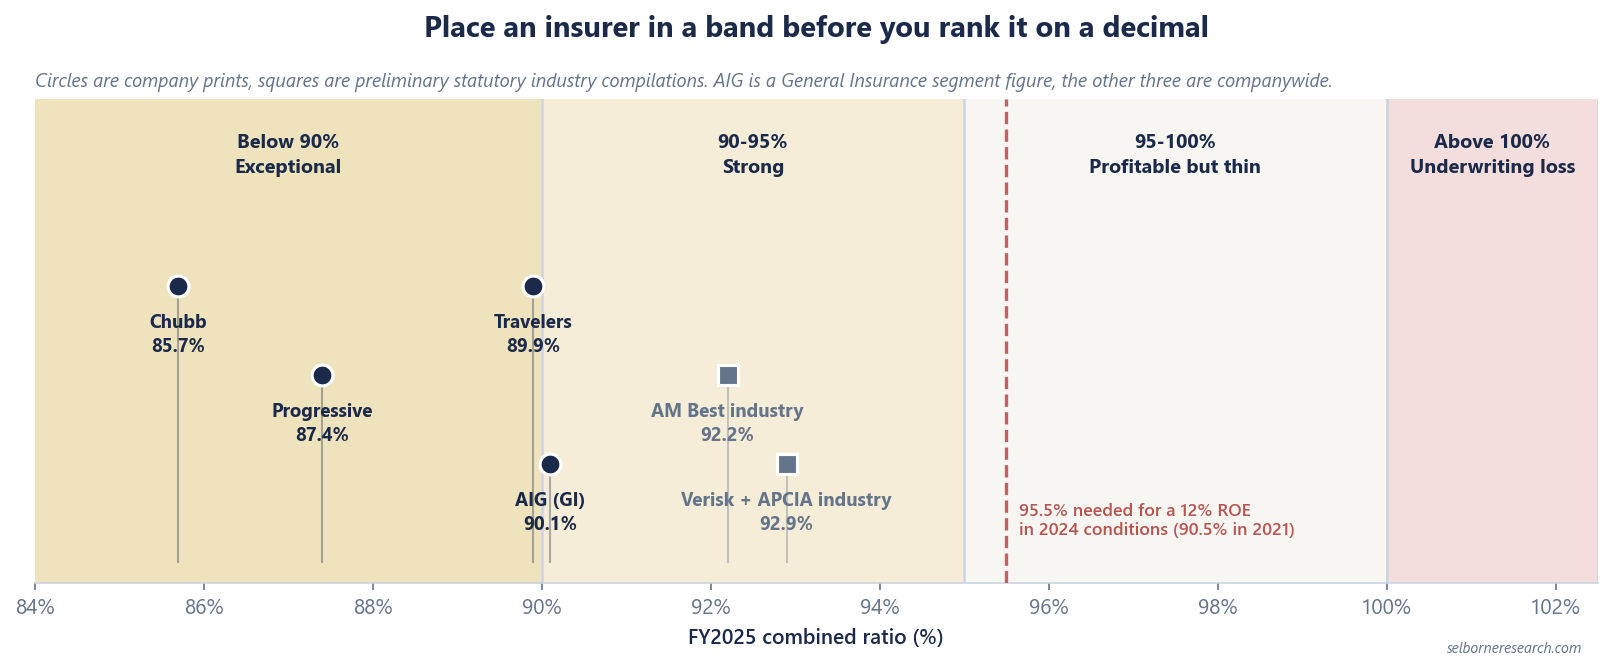
The spread from top to bottom of that company list is 4.4 points, which is narrow. That is what a good year looks like: the aggregate improved 3.7 points on 2024 by Verisk’s count, from 96.6% to 92.9%, and every name in the set beat it. In a heavy catastrophe year the same four would fan out much further, because their exposure to a single peril differs far more than their expense discipline does.
Note the basis column doing real work. AIG’s 90.1% is a segment figure for General Insurance, not a group-wide number, so its position on the ladder is not strictly like-for-like with the other three.
What Moves a Company Between Bands
Four things explain most of the placement, and only one of them is management effort in the year.
Line mix sets the floor. Short-tail personal lines report a loss quickly and let the insurer reprice quickly; long-tail casualty books take years to reveal what a policy year actually cost. That difference in feedback speed, not any inherent superiority of one book over the other, is why a personal-lines writer can correct a bad ratio in a couple of renewal cycles and a casualty writer cannot.
Catastrophe exposure is the biggest single swing factor and the least controllable. Catastrophe losses added an estimated 7.6 points to the 2025 US industry combined ratio, against 8.8 points in 2024. A property-heavy writer carries a structurally higher ratio in exchange for a structurally higher premium; that is a business model choice, not underperformance.
Expense discipline is the quietest of the four. It moves slowly, it rarely reverses, and it compounds. Two insurers with identical loss ratios and a four-point gap in expense ratio sit in different bands permanently.
Reserving posture is where the ratio is most easily flattered. Favourable prior-year development lowers the calendar-year ratio without saying anything about whether this year’s pricing is adequate. AIG’s FY2025 favourable development of $548m took 2.1 points off its General Insurance combined ratio; Progressive booked $1,394m favourable, Chubb $1,133m pre-tax, and Travelers $1,036m pre-tax. Strip the development out before you compare, and read the pattern through the reserve development lens. US casualty ran 17 consecutive years of favourable development before the run ended in 2023, when the industry took $3.7bn adverse on liability lines, followed by $7.8bn in 2024. Streaks like that end, and they end on the long-tail books.
Reading the Industry Aggregate as Context
The aggregate is a reference point that moves every year, so no company passes or fails against it. It reflects the same catastrophe year, the same pricing cycle, and the same reserve decisions your company faced, which is exactly why the gap between a company and the aggregate tells you more than either figure alone.
Two compilations are worth knowing. AM Best covers roughly 96% of industry net premiums written; Verisk with APCIA covers roughly 97.8% of US P&C business. Both are preliminary statutory tallies published in March following the year end, so they arrive after company GAAP results and can be revised. They also differ from GAAP company reporting on accounting basis, which is why a 6.5 point gap between Chubb and AM Best is a fair directional read but not a precise one.
The useful discipline: track a company’s gap to the aggregate across years. A name that beat the aggregate by six points in a benign year and by one point in a catastrophe year is telling you its edge sits in the expense line rather than in lighter catastrophe exposure. The reverse pattern says the opposite.
Dropping a New Name onto the Ladder
Before you place a company, settle four questions. Each one can move the number by more than the difference between two bands.
- What entity is this? Consolidated, a segment, or a statutory subsidiary. Segment ratios are usually the flattering ones, because the difficult run-off book sits elsewhere.
- Calendar year or accident year? Calendar year includes prior-year development; accident year does not. Firms often quote the accident-year ex-catastrophe ratio in presentations and the calendar-year ratio in the release.
- How much of the gap is catastrophes and development? Both are disclosed in points. Back them out, and you are left with the underlying ratio, which is what actually persists.
- What year is the aggregate from? Comparing a 2025 company print with a 2023 industry figure produces a flattering answer for reasons that have nothing to do with the company.
Life insurers do not report a combined ratio at all. MetLife and Prudential Financial run general-account spread businesses, so their economics live in portfolio yield against credited rates rather than loss plus expense.
The Number to Watch Is the Gap, Not the Level
A combined ratio in isolation ages badly, because the whole industry moves together with the catastrophe year and the pricing cycle. A company’s position relative to the aggregate, held across several years and adjusted for reserve development, does not. When a name that habitually ran five points inside the industry starts running two, the underwriting edge is eroding regardless of whether the printed ratio went up or down.
Placing an insurer in a band is where this guide ends. The primer prices that band into a residual-income schedule.
The Excel model is the primer's three residual-income valuations live across 13 sheets: change the combined ratio, the spread or the cost of equity and the justified P/BV moves.
Frequently Asked Questions
- What is a good combined ratio by company?
- Judge it by band rather than by level. Below 90% is exceptional underwriting and usually needs a structural edge in line mix, distribution cost, or catastrophe exposure. 90-95% is strong. 95-100% is still an underwriting profit but a thin one, with investment income doing much of the work on returns. Above 100% the book loses money before investment income. For scale: the FY2025 prints ran 85.7% at Chubb, 87.4% at Progressive, 89.9% at Travelers, and 90.1% for AIG General Insurance.
- What is the industry average combined ratio?
- Two preliminary FY2025 statutory compilations of the US property-and-casualty industry put it at 92.2% (AM Best, covering roughly 96% of industry net premiums written) and 92.9% (Verisk with APCIA, covering roughly 97.8% of US P&C business). Both were released in March 2026, and both improved sharply on 2024, when the Verisk figure was 96.6%. Read the aggregate as a moving reference for the year, not as a fixed pass mark.
- Why do two insurers with the same combined ratio earn different returns?
- Because the combined ratio only scores underwriting. Reserve leverage, portfolio yield, and tax position decide how much investment income sits behind the same underwriting margin. An insurance trade-body study of the US P&C industry found it needed roughly a 95.5% combined ratio to earn a 12% return on equity in 2024 conditions, against 90.5% in 2021; the required ratio tightens when yields fall and loosens when they rise.
- Should I compare a segment combined ratio with a companywide one?
- No, and the mismatch is common. AIG reports 90.1% for FY2025 General Insurance, a segment figure, while Chubb, Progressive, and Travelers quote companywide ratios. Before ranking any name, check three labels: the reporting entity (segment or consolidated), calendar year versus accident year, and whether the figure is stated before or after catastrophe load and prior-year reserve development.