FRE Margin Benchmarks 2026: Blackstone to Carlyle
How to place any listed alternative manager on the fee-related earnings margin ladder, and the denominators that break cross-firm comparison.
Educational analysis for professional use. This guide is not investment advice or a recommendation to buy or sell any security, and it is not personalised.
The Margin Ladder Is the Operating-Leverage Screen
FRE margin is fee-related earnings divided by fee-related revenue: how much of the management-fee stream survives the cost base. It is the cleanest read on operating leverage in the sector, because both sides of the ratio are recurring. Nothing in it depends on when a fund exits an asset.
The useful question is never “is 52% good?” It is “which band should this firm be in, given its scale and strategy mix, and is it in that band?” That framing survives the next reporting season, which a list of current percentages does not. What follows builds the ladder, then the mechanism that puts a firm on each rung. For the earnings layer above this one, see our FRE versus distributable earnings guide.
FY2025: Where the Six Majors Landed
| Company | FY2025 FRE | FRE margin | Fee-paying base (end-FY2025) | Basis note |
|---|---|---|---|---|
| KKR | $3.7B | 69% | $604B FPAUM | Filed |
| Blackstone | $5.7B | ~58.3% | $921.7B fee-earning AUM | Computed from segment table |
| Brookfield AM | $3.0B | 58% | $603B fee-bearing capital | At our share, LTM |
| Apollo | $2.5B | 56.6% | $709B fee-generating AUM | Asset management segment only |
| Carlyle | $1.2B | 47% | $337B fee-earning AUM | Filed |
| Ares | $1.8B | 41.7% | $384.9B FPAUM | Filed |
Twenty-seven points separate the top of that list from the bottom, in a sector that reads as homogeneous in headlines. The basis column matters as much as the percentage; four of the six numbers are not built the same way, which is covered further down.
Note what the ranking does not do. It does not sort by size of fee base: Blackstone runs the largest fee base and sits second. It does not sort by strategy: Apollo and Ares are both credit-led and sit fifteen points apart.
The Bands, and What Puts a Firm in Each
These are working ranges rather than filed standards. Each is anchored to a name in the FY2025 set, and each describes a cost structure rather than a company.
| Band | FRE margin | The structure behind it |
|---|---|---|
| Credit specialist | 40–45% | Lower management fee rate per dollar of fee base, and a servicing and distribution cost that does not scale down with it. Ares 41.7%. |
| Diversified mid-scale | 45–50% | Fixed platform cost (technology, compliance, fundraising) spread over a fee base in the low hundreds of billions. Carlyle 47%. |
| Scaled multi-strategy | 55–65% | Fee base large enough that platform cost per dollar managed falls away. Blackstone ~58.3%, Brookfield 58%, Apollo 56.6%. |
| High-margin scaled | up to ~70% | The practical ceiling in the listed set. KKR 69%. |
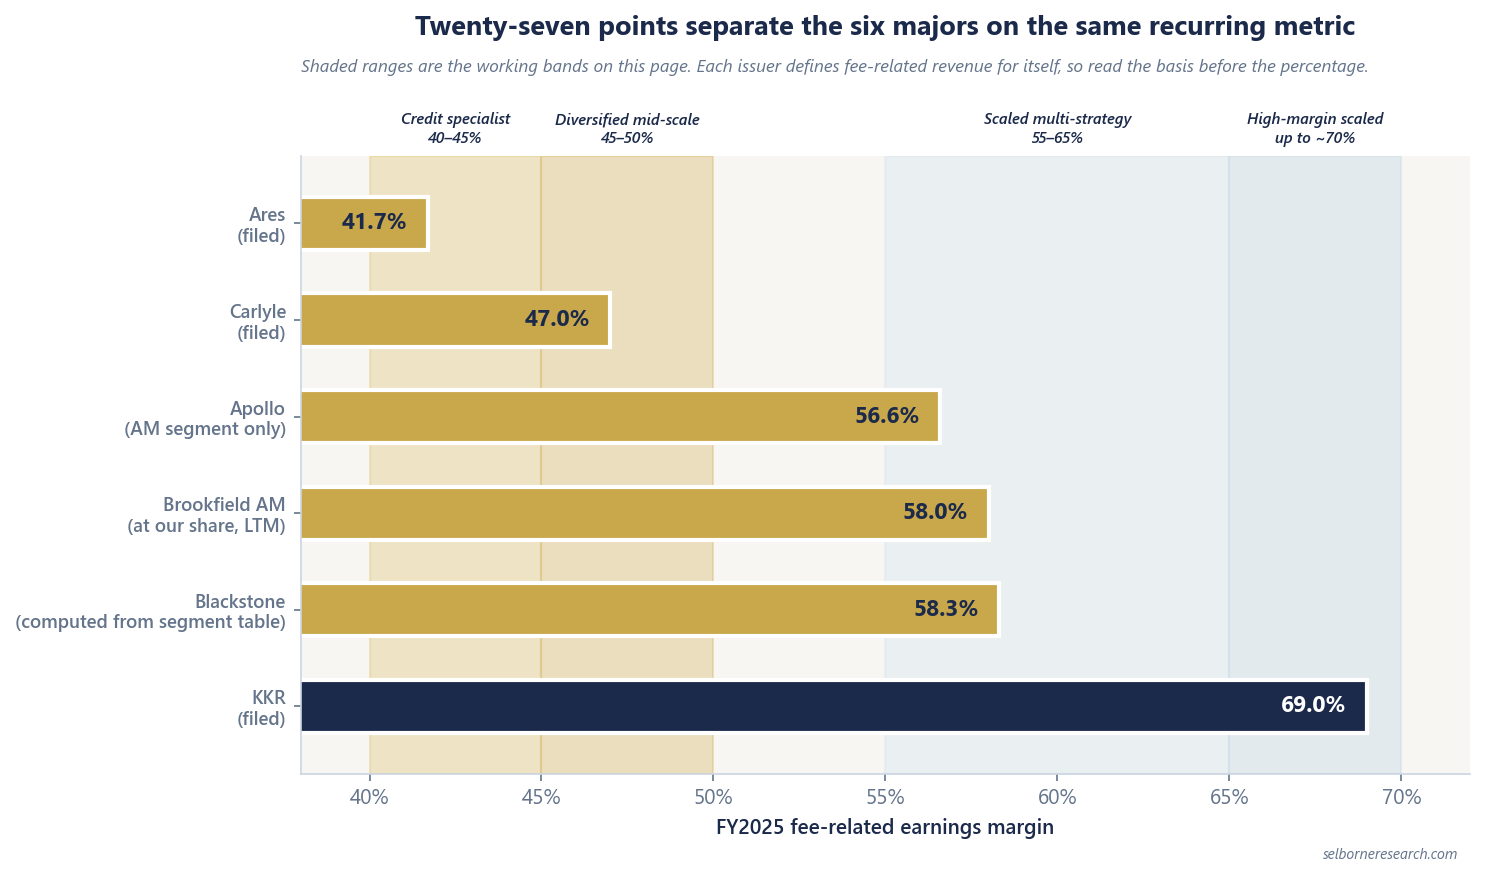
The jump from the second band to the third is the one worth understanding. It is not a strategy change; it is scale arriving. Between roughly $350B and $600B of fee-paying base, the same compliance function, the same fund-administration stack and the same investor-relations team serve a much larger revenue line.
Margin Is Two Yields, Not One
The most durable way to read this ratio is to stop treating it as a percentage and split it into basis points on the fee base. Revenue yield is fee-related revenue divided by the fee-paying base. Cost yield is the fee-related cost base divided by the same denominator. Margin is simply one minus their ratio.
That decomposition tells you why a margin moved, which the percentage alone never does. A margin can fall because the firm won a large mandate at a thin fee rate (revenue yield down, cost yield roughly flat) or because it built out a distribution arm (cost yield up). Those are opposite signals wearing the same number.
Blackstone FY2025 is the cleanest worked example, because it files both revenue components.
- Management and advisory fees, net: $8,016.0M
- Recurring fee-related performance revenues: $1,825.4M
- Fee-related revenues: $9,841.5M
- Fee-related earnings: $5,737.5M
- FRE margin: 5,737.5 ÷ 9,841.5 = 58.3%
- Implied fee-related cost base: 9,841.5 − 5,737.5 = $4,104.0M
Now put all three on the $921.7B fee-earning base: revenue yield ~107 bps, cost yield ~45 bps, FRE yield ~62 bps. Those are rough figures, because a full year of revenue is being divided by a period-end base that moved through the year. They are still the right shape to carry into a forecast. If you think Blackstone adds fee base at a lower average fee rate, you can say what that does to the 107 and decide separately whether the 45 moves with it.
Run the same three numbers for any manager and the ladder stops being a table you memorise.
Fee Rate Sets the Revenue Yield
Different strategies price differently on the same dollar of committed capital. Working ranges for management fees on the fee-paying base: drawdown private equity around 0.75–1.25%, private credit around 0.50–0.85%, and real assets or perpetual vehicles around 0.40–0.70%.
A credit-heavy or real-assets-heavy manager therefore starts with a structurally lower revenue yield. That is not automatically a lower margin. It becomes one only if the cost of running each dollar does not fall by as much, which is usually the case: a credit fund still needs underwriting, servicing, reporting and a distribution channel.
This is what separates Ares from Carlyle in FY2025. Ares managed a larger fee-paying base ($384.9B against $337B) and reported the lower margin, 41.7% against 47%. Carlyle’s private equity fee rate does more work per dollar. Apollo shows the same mechanism running the other way: also credit-led, but at $709B of fee-generating AUM the platform cost is thin enough to support 56.6%.
Perpetual Capital Is a Duration Story, Not a Margin Story
Perpetual vehicles remove the re-raise. A drawdown fund has to be fundraised again every few years; a perpetual one does not, so the fundraising cost per dollar of durable fee base should fall. That logic is real, and it is priced: platforms with more than half of fee-paying AUM in perpetual vehicles trade at a premium, which our valuation guide sets out.
It does not follow through to the margin as reliably as analysts expect.
| Company | Perpetual share (basis as filed) | FRE margin |
|---|---|---|
| Brookfield AM | 87% of fee-bearing capital | 58% |
| Apollo | more than 70% of fee-generating AUM | 56.6% |
| KKR | 51% of FPAUM | 69% |
| Blackstone | 48% of fee-earning AUM | ~58.3% |
| Carlyle | 33% of fee-earning AUM | 47% |
| Ares | 32% of total AUM strictly perpetual | 41.7% |
Read that column downwards and the relationship falls apart in the middle. KKR sits at 51% and earns the highest margin in the sector; Brookfield sits at 87% and earns eleven points less. Apollo is above 70% and lands below both. Perpetual capital changes how long the fee base lasts and how much of it has to be re-won each cycle. It does not change what it costs to run a dollar of it, and the semi-liquid vehicles that raise the perpetual share carry their own distribution and servicing costs inside the fee-related cost base.
Ares needs its own note, because it is quoted two ways. Only 32% of its AUM is strictly perpetual, the lowest in the set, but it describes 85% as perpetual or long-dated, which sweeps in closed-end credit vehicles with long but finite lives. Set the 85% against the others’ strict figures and Ares looks like the most durable franchise here rather than one of the least. Take the strict number when you are ranking, and the broader one when you are asking how soon the money has to be re-raised. For the definitions and the peer shares, see our fee-paying AUM and perpetual capital guide.
Compensation Is the Swing Line on the Cost Side
Fee-related earnings deduct two things from fee-related revenue: fee-related compensation, and fee-related operating expenses. Compensation is the larger of the two and by far the more discretionary. It scales with headcount, and headcount is added ahead of the fee base a firm expects to raise, not alongside the one it already has.
That timing is what makes a single year’s margin a poor verdict. A manager building out a private credit team or a wealth distribution channel takes the cost immediately and the fee revenue two to four years later, so the margin dips while the franchise is being built. The same dip looks identical to a firm losing pricing power.
Separating the two takes three years of data, not one. Read the compensation line against the growth in the fee-paying base over the same period. Rising comp with a rising fee base is investment; rising comp with a flat fee base is not.
Denominators That Do Not Line Up
The percentage is the last thing to compare, not the first. Four traps recur in the FY2025 set.
Apollo’s 56.6% is segment-only. It covers asset management and excludes Athene’s spread earnings entirely. Setting it against a firm-wide margin understates Apollo’s economics and overstates its comparability.
Brookfield’s 58% is stated at our share and on a trailing-twelve-month basis. It is not a clean calendar-year, firm-wide figure, and Brookfield’s fee base ($603B of fee-bearing capital) is a different thing again from the over $1 trillion of platform AUM the group headlines.
Blackstone does not publish an FRE margin. The ~58.3% here is computed from the filed segment table. Any vendor screen showing a Blackstone margin has made the same choice of denominator, or a different one, without telling you which.
Everyone defines fee-related revenue for themselves. Whether recurring fee-related performance revenues are in the denominator, and whether fund expenses are netted against fees or grossed up, both move the margin by points. Blackstone’s $1,825.4M of recurring fee-related performance revenues is 19% of its fee-related revenue line; a peer that excluded the equivalent would print a different margin on identical economics.
Using the Ladder in a Screen
Place the firm before you judge the number. Take the fee-paying base, the strategy mix, and the perpetual share, and that gives you the band it should be in. Then compare the reported margin to that band and work on the gap.
A firm below its implied band is the interesting case. Either the cost base carries something the peer group does not (a distribution arm, an acquisition being integrated, a build-out in progress) or the fee rate is thinner than the strategy mix suggests, which points at pricing pressure. Both are findable: split the margin into the two yields and see which one is out of line.
A firm well above its band deserves the opposite question. Check whether the fee-related cost base has been growing slower than the fee base for several years running, and whether headcount has kept pace with capital raised. A margin held up by deferred hiring pays for itself later.
Then carry the margin into the valuation rather than stopping at it. FRE margin sets the FRE dollars; the multiple applied to those dollars is a separate decision driven by perpetual mix and growth. Two managers on the same margin can be twenty turns apart on P/FRE.
For issuer-level FRE and cost detail, see our Blackstone, KKR and Ares Management profiles.
One Number to Take Away
If you keep one thing from this page, keep the two-yield split rather than the ladder. The bands will move as the sector consolidates and as fee rates compress. Revenue per dollar of fee base and cost per dollar of fee base will still be the only two quantities that make a margin what it is, and every explanation offered for a margin change has to show up in one of them.
Alternative Asset Managers Primer
A margin band places a firm on a rung. The primer feeds that margin into a ten-year FRE DCF.
The Excel model is the primer's two worked valuations live across 12 sheets: change fee-paying AUM, FRE margin or the fundraising rate and the valuation moves. It holds two company slots, one per worked case, not a full peer table.
Frequently Asked Questions
- What is a good FRE margin for an alternative asset manager?
- Judge it against the archetype rather than a single number. Working bands: credit specialists around 40–45%, diversified mid-scale managers 45–50%, scaled multi-strategy platforms 55–65%, with roughly 70% the practical ceiling seen in the listed set. FY2025 filed figures span 41.7% (Ares) to 69% (KKR), with Blackstone at ~58.3% computed from its segment table. A margin is good if it is above the band its scale and strategy mix imply, and if the gap is widening rather than being held up by deferred hiring.
- Which listed alternative manager has the highest FRE margin?
- KKR, at 69% for FY2025 on FRE of $3.7B. Blackstone follows at ~58.3% (FRE $5,737.5M on fee-related revenues of $9,841.5M), Brookfield Asset Management at 58%, and Apollo at 56.6% on its asset management segment. Carlyle reported 47% and Ares 41.7%. These are FY2025 figures on each issuer’s own definition of fee-related revenue; re-derive them from the latest segment tables before using them.
- Why does Ares report a lower FRE margin than Carlyle when it manages more capital?
- Ares ran $384.9B of fee-paying AUM at end-FY2025 against Carlyle’s $337B of fee-earning AUM, yet reported 41.7% versus 47%. Credit strategies price at lower management fee rates than flagship private equity, so each dollar of fee base generates less revenue, while the cost of servicing and distributing those vehicles does not fall in proportion. Strategy label alone does not set the margin: Apollo is also credit-led and reported 56.6%.
- Are FRE margins comparable across managers?
- Not without checking the denominator. Each issuer defines fee-related revenue for itself. Apollo’s 56.6% covers the asset management segment only and excludes Athene spread earnings; Brookfield’s 58% is quoted at its share on a trailing-twelve-month basis; Blackstone does not headline a margin at all, so ~58.3% is computed from the filed segment table. Compare the underlying revenue and cost lines before you compare the percentages.