The Life Insurance Spread Business
General-account spread mechanics, MetLife 115 bps versus Prudential disclosure gaps, and verified FY2025 portfolio yields and new-business metrics.
Educational analysis for professional use. This guide is not investment advice or a recommendation to buy or sell any security, and it is not personalised.
Life Insurers Earn Spread, Not Combined Ratio
Property-and-casualty analysts open with the combined ratio. On life and retirement books the first question is general-account spread: what the portfolio earns versus what the insurer credits on liabilities. There is no meaningful P&C-style combined ratio here. ROE comes from spread income on account balances, capital efficiency, and new-business growth.
MetLife and Prudential Financial, the two life names in our comp set, illustrate the lens. Both trade on P/BV vs ROE like P&C peers, but the earnings engine behind those multiples is spread and new business, not loss ratio plus expense ratio.
General-Account Spread: The Core Metric
Spread (bps) = portfolio yield − credited rate on liabilities
| Company | FY2025 spread / yield | Disclosure |
|---|---|---|
| MetLife | 115 bps general-account spread; 4.91% total investment income yield | Spread and yield both filed |
| Prudential | 4.32% general-account yield after investment expenses (4.49% gross) | No consolidated spread bps disclosed |
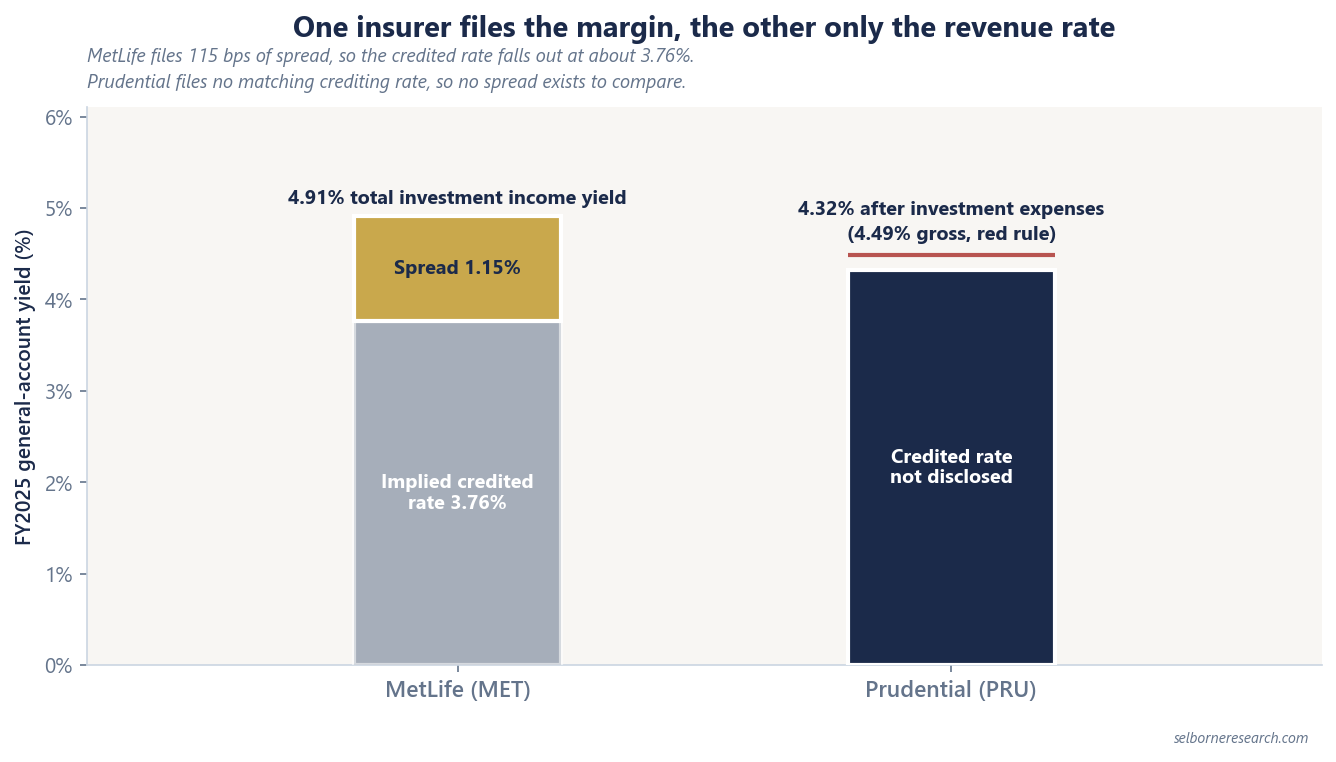
MetLife’s 115 bps is the cleanest spread print in the set: portfolio earns 4.91%, liabilities are credited less, and the 1.15% gap scales across a large general account.
Prudential publishes no consolidated spread in basis points. What it does file is the asset side: the general account earned 4.49% gross in FY2025 and 4.32% after investment expenses. The crediting rates on the other side are not disclosed in a matching form, so no spread number falls out, and a portfolio yield is not a spread.
Resist the urge to manufacture one. Weighting two large segment yields together gives a figure above the filed whole-account yield, which no portfolio can earn, because the segments left out of the build are the lower-yielding ones. Where the disclosure is missing, say it is missing.
FY2025 Life Comp Snapshot
| Metric | MetLife (MET) | Prudential (PRU) |
|---|---|---|
| GAAP ROE | 12.9% | 11.7% |
| Adjusted / operating ROE | 16.0% ex-notables | 14.9% operating |
| Adjusted BVPS ex-AOCI | $57.07 | $100.78 GAAP BV ex-AOCI |
| P/BV (10 Jun 2026) | ~1.53× | ~1.05× |
| NII | $22,559M GAAP; $21,432M adjusted | $18,938M adjusted operating |
| Portfolio yield | 4.91% total investment income | 4.32% after expenses; 4.49% gross |
| New-business metric | Adjusted PFO ex-PRT $49.8bn (+5%) | ANBP $611m Group / $955m Individual Life |
| Reserve / assumption item | AAR notables $89m (not PYD) | Annual assumption updates (e.g. IRS $81m) |
Both names sit in the 8–16% ROE P/BV band (~1.05–1.53×), but MetLife’s disclosed spread gives a clearer read on earning power than Prudential’s yield-only disclosure.
New-Business Lens: PFO vs ANBP
Neither MetLife nor Prudential published FY2025 value of new business (VNB), so comp work uses what each name actually files. MetLife reports adjusted premiums, fees and other excluding pension risk transfers: $49.8bn, up 5% FY2025. That is a volume and mix scoreboard, not a spread margin. Prudential filed annualised new business premiums instead: $611m Group Insurance and $955m Individual Life. ANBP tracks sales pace; it does not translate directly to present value of future profits. Use these for growth direction, not as a substitute for spread bps.
AAR Notables Are Not P&C PYD
MetLife FY2025 actuarial assumption review (AAR) notables were $89m (all in Q3), with total notables net of $(43)m. Prudential disclosed annual assumption updates by segment rather than an aggregate calendar-year development figure.
These are not comparable to Progressive’s $1,394m favourable PYD or AIG’s $548m release. Life assumption reviews reset mortality, lapse, and interest-rate assumptions on in-force blocks. P&C PYD revises ultimate loss estimates on prior accident years. Different products, different actuarial mechanics, different screens.
Worked Example: Spread to Earning Power
MetLife FY2025:
| Input | Value |
|---|---|
| General-account investment spread | 115 bps (1.15%) |
| Total investment income yield | 4.91% |
| Implied credited rate (yield − spread) | ~3.76% |
| GAAP net investment income | $22,559m |
If the general account earns 4.91% and the spread is 115 bps, the implied average credited rate is about 3.76%. The 115 bps accrues to shareholders, scaled by account size and capital requirements. Spread compression of 20 bps on a large general account is a material earnings event; that is why life analysts track spread quarterly while P&C analysts track combined ratio.
Prudential offers no such line. The most you can honestly do is read the filed asset yield, 4.32% after expenses, and note that the liability side is not published in matching form. Comparing MetLife’s spread with Prudential’s yield is comparing a margin with a revenue rate.
Contrast With P&C Economics
| Lens | P&C (CB, PGR, TRV, AIG) | Life (MET, PRU) |
|---|---|---|
| Primary profitability metric | Combined ratio | General-account spread |
| Reserve signal | Prior-year development (PYD) | AAR notables / assumption updates |
| Investment engine | Float-funded NII | General-account portfolio NII |
| New business | NEP growth, combined ratio guardrails | PFO, ANBP, VNB where disclosed |
The float guide covers P&C float and NII label traps. Life NII is larger in absolute dollars (MetLife $22.6bn vs Chubb $6.5bn pre-tax) because general-account assets dwarf P&C float portfolios, but the economic question is spread persistence, not underwriting margin.
Rate Sensitivity
The spread moves because the two sides of it reprice at different speeds, and which way it moves depends on the direction of rates.
When rates fall, the portfolio yield drifts down as maturing bonds are reinvested at lower coupons, but the credited rate cannot follow all the way down: many policies carry a guaranteed minimum, and once the crediting rate is sitting on that floor every further point of yield decline comes straight out of the spread. That is the classic life-insurer squeeze, and it is why a long stretch of low rates hurts these businesses years after the rates themselves have moved.
When rates rise the asymmetry works the other way. Portfolio yields grind up with each reinvestment while credited rates lag, so the spread widens, though competition for annuity money eventually forces the crediting rate higher. MetLife’s 115 bps is one year’s print, not a constant; the quarterly filings show whether it holds.
What to Screen
For life names, start with general-account spread where disclosed, portfolio yield trend, adjusted ROE ex-notables, new-business volume (PFO or ANBP), and P/BV against sustainable ROE. Skip P&C combined ratio and aggregate PYD screens. When one comp files 115 bps of spread and another files only a portfolio yield, the two are not on the same screen and no amount of arithmetic puts them there.
General-account spread is a margin, and this guide ends there. The primer runs a life book to intrinsic value per share.
The Excel model is the primer's three residual-income valuations live across 13 sheets: change the combined ratio, the spread or the cost of equity and the justified P/BV moves.
Frequently Asked Questions
- What is the life insurance spread business?
- Life insurers earn the spread between what the general-account portfolio yields on invested assets and what they credit on insurance liabilities (policyholder account balances, annuity crediting rates, etc.). Spread income, scaled by account size and capital, drives ROE alongside new-business growth. There is no P&C-style combined ratio on life books.
- What is general-account investment spread?
- General-account investment spread equals portfolio yield minus credited rate on liabilities, expressed in basis points. MetLife disclosed 115 bps average annualised general-account spread for FY2025. Prudential does not publish consolidated spread bps at all: it files the asset side only, a 4.49% gross general-account yield and 4.32% after investment expenses, with no matching credited-rate disclosure. A portfolio yield is not a spread, and a spread built out of segment yields is a guess wearing a decimal point.
- How do life insurers measure new business?
- Disclosure varies. MetLife reclassified to adjusted premiums, fees and other (PFO) excluding pension risk transfers: $49.8bn (+5% FY2025). Prudential reports annualised new business premiums (ANBP): $611m Group Insurance and $955m Individual Life. Neither disclosed FY2025 value of new business (VNB).
- Do life insurers report prior-year reserve development like P&C?
- No. Life insurers report actuarial assumption review (AAR) notables and annual assumption updates, not P&C-style aggregate calendar-year PYD. MetLife FY2025 AAR notables were $89m. Prudential disclosed segment-level assumption updates (e.g. IRS $81m net charge from the annual review). Do not screen life names on P&C PYD metrics.